Bitcoin Price Fails to Break $67,000, Oil and Tech Earnings a Hurdle?
2026-07-23
Bitcoin Price the dollar has resurfaced near $67,000, but has yet to decisively break through that level. Surging oil prices, inflation concerns, and uncertainty ahead of tech companies' earnings reports have made investors more cautious about riskier assets.
Key Takeaways
- Bitcoin faces major resistance around $66,950–$67,000 and needs a daily close above that area to confirm a breakout.
- Rising oil prices could amplify inflationary pressures and reduce the chances of looser monetary policy.
- Bitcoin ETF inflows are still positive, but they are decreasing and not yet strong enough to push the price past resistance.
What Happened to Bitcoin Price?
On July 22, 2026, Bitcoin briefly reached an intraday price of around $66,886 before falling back to the $65,700–$66,000 area. This movement occurred after BTC recovered from its early July low of around $57,799.
On July 23, 2026, Bitcoin was trading at around $65,761, with a daily trading range between approximately $65,524 and $66,313. This indicated that buyers were still holding the price above $65,000, but had not yet broken through the psychological resistance level of $67,000.

Sumber: AI Generated Image
The recovery from below $58,000 to nearly $67,000 indicates that demand has returned. However, the rapid rise also encouraged short-term traders to take profits as the price approached its previous peak.
The $67,000 area is now a key milestone, as it's more than just a psychological level. It's adjacent to the previous recovery peak and represents a crucial barrier to break through to establish a stronger bullish price structure.
Read also:Bitcoin and Ethereum Short Positions Expand, Signaling Crypto Prices Will Fall?
Why Did Bitcoin Fail to Break $67,000?
Bitcoin failed to break through $67,000 as it faced a combination of technical resistance and macroeconomic uncertainty.
Some of the main causes are:
- Profit-taking after a sharp recovery from below $58,000.
- Sellers were active around the June peak.
- Concerns about rising energy prices.
- Uncertainty about earnings of big tech companies.
- ETF inflows are starting to slow down.
- Leveraged positions concentrated around key levels.
- The long-term trend has not yet fully turned bullish.
Key resistance is located around $66,950. A daily close above that level could result in the first higher high since the May rally and turn $67,000 into a new support area. However, as long as the price remains rejected below it, the breakout cannot be considered valid.
Bitcoin also remains below its 100-day and 200-day moving averages, which were around $70,126 and $72,730 on July 22nd. This indicates that the medium- to long-term trend has not fully recovered.
Read also:Strategy: Why You Shouldn't Buy Bitcoin for the First Time?
How Does Oil Price Impact Bitcoin?
Oil prices don't directly impact Bitcoin. Their impact is driven by inflation, interest rates, bond yields, liquidity, and investor risk appetite.
On July 22, 2026, WTI oil rose more than 4% to around $87.99 per barrel, while Brent oil hovered above $94. This rise was driven by increasing risks to oil supply chains due to geopolitical tensions.
High oil prices can increase costs:
- Transportation.
- Production of goods.
- Logistics.
- Electricity and energy.
- Journey.
- Industrial raw materials.
If energy costs remain high, inflation could rise again or decline more slowly than expected. This could prompt central banks to maintain high interest rates for longer or even consider raising them.
Bitcoin is often treated as a risky asset in the short term. When interest rates and bond yields rise, investors may shift some funds to instruments that offer more stable returns.
Therefore, a surge in oil prices could hinder Bitcoin through the following channels:
Oil prices rise → risk of inflation increases → interest rates potentially remain high → liquidity decreases → demand for risky assets weakens.
These impacts aren't always permanent. However, when Bitcoin is testing key resistance, a shift in macro sentiment can be enough to derail a breakout.
Read also:Michael Saylor Signals Another Bitcoin Buy. Will Strategy Add BTC This Week?
What Impact Does Tech Company Earnings Have?
Tech companies' financial reports impact Bitcoin because crypto assets often move in the same direction as tech stocks when the market is in risk-on or risk-off conditions.
Investors were awaiting results from several major companies, including Alphabet and Tesla. Market focus was on the technology companies' ability to generate revenue from their massive spending on artificial intelligence.
Technology earnings can affect Bitcoin through several channels.
Sentiment towards Risky Assets
Better-than-expected results could bolster optimism about economic growth and encourage investors to return to tech and crypto stocks.
Conversely, disappointing results could trigger a sell-off in the Nasdaq and other risk assets.
AI Infrastructure Shopping
The market wants to see whether heavy investments in data centers, chips, cloud and artificial intelligence are generating commensurate revenue growth.
If companies signal they will reduce AI spending, semiconductor stocks could be under pressure. A weakening sector could dampen the risk-on sentiment that supports Bitcoin.
Market Volatility
Ahead of major earnings, investors often reduce their positions to avoid surprises. This defensive attitude can discourage Bitcoin buyers from making aggressive trades near resistance.
Read also:Why Are Bitcoin and Ethereum Remaining Stable Despite the Re-escalation of the US-Iran Conflict?
What is the Current Technical Analysis of Bitcoin?
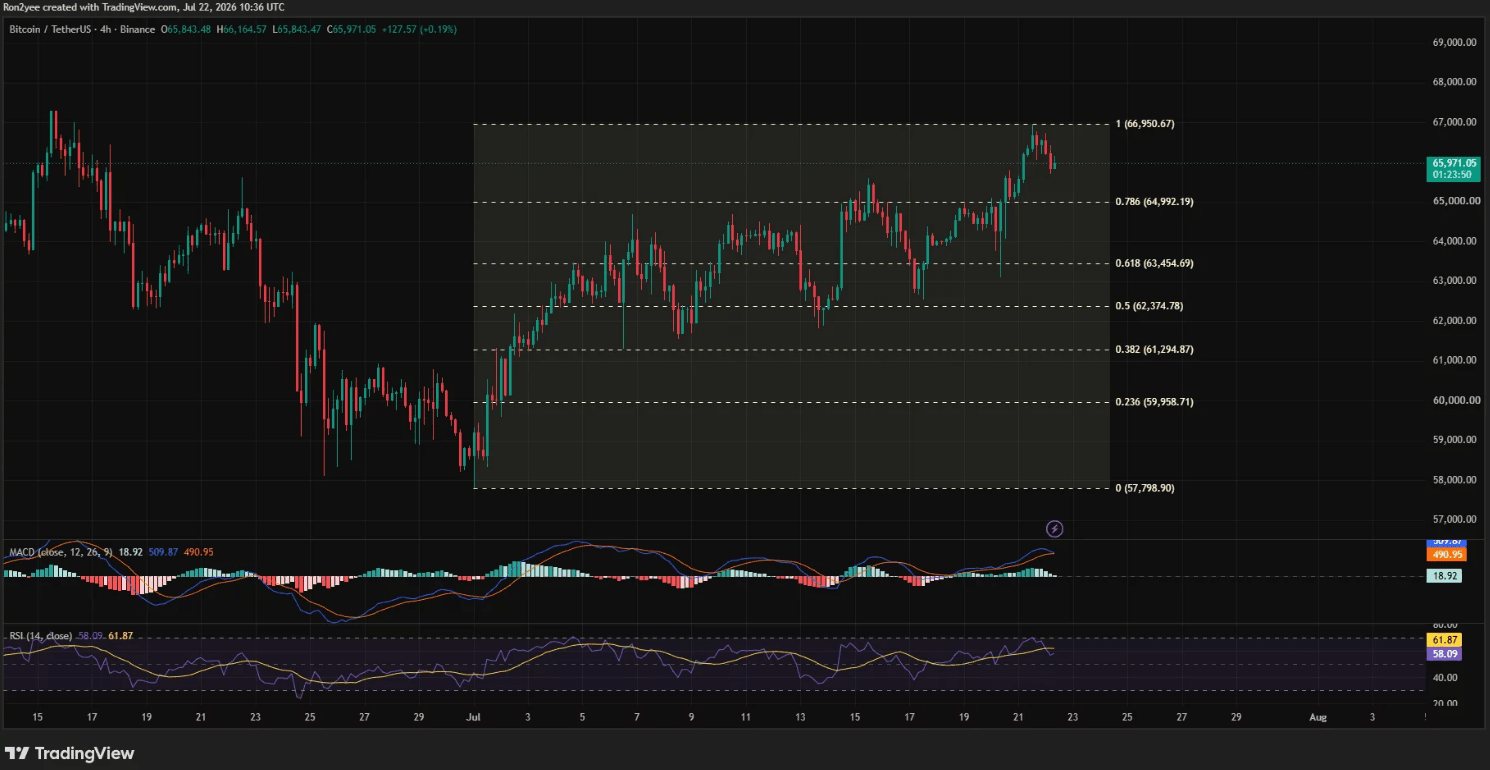
Technically, Bitcoin is showing a constructive recovery, but momentum is starting to slow after rejection near $67,000.
Source: Crypto News
On the four-hour chart, the relative strength index (RSI) is around 58.09. This figure indicates that momentum remains positive and has not yet entered overbought territory, but buyer strength is not as strong as it was at the start of the rally.
The MACD remains above the signal line. However, the positive histogram is starting to narrow, indicating that the accumulation rate is slowing.
On the daily chart, Bitcoin is above:
- The 20-day SMA is around $64,065.
- The 50-day SMA is around $63,135.
These two levels serve as initial dynamic support. Chaikin Money Flow is also in positive territory, around 0.13, indicating that capital inflows have continued to outweigh outflows during the recent recovery.
However, the bullish signal is not complete because the price is still below:
- The 100-day SMA is around $70,126.
- The 200-day SMA is around $72,730.
Bitcoin needs to reclaim that area to show a more convincing trend reversal.
Apa Level Support Bitcoin?
Bitcoin's nearest support level is around $65,000. As long as this level holds, buyers still have a chance to retest $66,950–$67,000.
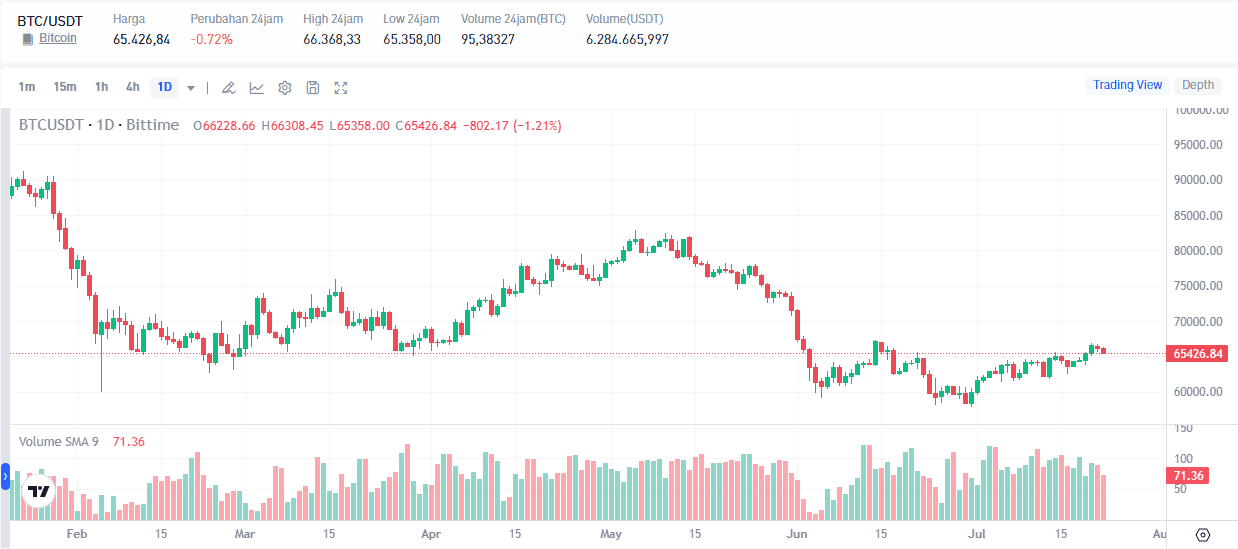
Support levels to watch out for include:
Support $65.000
This area serves as a psychological barrier and the first line of defense for buyers. A brief decline below this level is still possible, but a consistent close below it could weaken momentum.
Support $64.992
This level is close to the 78.6% Fibonacci retracement level. A four-hour close below it could make the recovery structure more fragile.
Support $64.065–$63.135
This area is formed by the 20-day and 50-day SMAs. A breakout of these two averages could signal that the short-term recovery is starting to fail.
Support $63,455 and $62,375
These two levels will be the next decline targets if the price is unable to maintain $64,992.
Support $61.295
This level becomes a deeper bearish scenario if Bitcoin loses the daily moving average area and selling pressure continues to increase.
Read also:Glassnode Bitcoin Analysis: A Bottom Is In Sight, But a Bull Market Isn't Here Yet
What is the BTC Resistance Level?
Bitcoin resistance to pay attention to is:
Resistance $66.950–$67.000
This is a major obstacle. Bitcoin needs a strong daily close above this area, not just a temporary surge.
Resistance $67.300
There is a concentration of short positions around this level. If the price breaks through, short liquidation could accelerate the rally.
Resistance $68.000
The $68,000 area also holds a significant pool of liquidity. A breakout above $67,300 could pave the way for a move towards this level.
Resistance $70.126
This level is close to the 100-day SMA and serves as medium-term technical resistance.
Resistance $72.730
The 200-day SMA is located around this area. A sustained breakout could reduce the influence of the previous downtrend.
Target $76.000
If Bitcoin manages to reclaim the long-term moving average, the $76,000 area could become the next bullish target. However, this target still depends on successful breakouts above $67,000, $70,000, and $72,700.
Read also:Bernstein's $150,000 Bitcoin Target Remains Despite 54% Pullback
How Big Are Bitcoin ETF Inflows?
Bitcoin ETF flows are still positive, but the pace is starting to slow.
On July 21, 2026, ETF spot Bitcoin The United States recorded net inflows of approximately $203.2 million. The largest products contributed approximately $163.9 million, while other major products earned approximately $23.1 million.
On July 22, total net inflows dropped to approximately $69.1 million. This figure remains positive, but significantly lower than the previous day.
Positive ETF flows indicate that institutional demand hasn't dissipated. However, the drop from $203.2 million to $69.1 million suggests that buying power isn't yet strong enough to automatically push Bitcoin past resistance.
ETFs can support prices through purchases of underlying assets, but their effect is influenced by:
- Large net inflow.
- Sales from other holders.
- Derivatives market activity.
- Global liquidity conditions.
- Macro sentiment.
- Leveraged position.
- Dollar movements and bond yields.
Thus, positive ETF flows are a supportive signal, not a guarantee of an increase.
Read also:Can Ethereum Beat Bitcoin in Q3 2026?
What is the Bitcoin Market Sentiment?
Current market sentiment can be categorized as optimistic but cautious.
Positive factors include:
- Recovery of approximately $57,799.
- Prices held above $65,000.
- ETF flows remain positive.
- The price is above the 20-day SMA and the 50-day SMA.
- Money flow is still positive.
- RSI is not overbought yet.
- There is a potential short squeeze above $67,000.
Meanwhile, negative factors include:
- Repeated rejection near $67,000.
- Oil prices are rising.
- Inflation risks are strengthening again.
- Bond yields remain high.
- Technology earnings add to uncertainty.
- MACD momentum is starting to weaken.
- Bitcoin is still below the 100-day SMA and 200-day SMA.
- Daily ETF flows declined.
This situation has placed the market in a waiting-for-confirmation phase. Buyers haven't lost control, but they don't yet have enough power to alter the long-term price structure.
Read also:The US Strategic Bitcoin Reserve is Hampered, What's Going On?
Bitcoin Price Prediction for the Future
Bitcoin predictions should be made in the form of scenarios, not single numbers.
Bullish Scenario
A bullish scenario occurs if Bitcoin:
- Holding above $65,000.
- Closing daily trade above $66,950.
- Breaking the $67,300 liquidation zone.
- Maintain purchase volume.
- Get ETF flow support.
- Experiencing positive sentiment from the stock market.
In this scenario, BTC could test $68,000, then move towards $70,126 and $72,730. If both long-term averages are broken, the $76,000 target becomes more relevant.
Neutral Scenario
Bitcoin could move in the $64,000–$67,000 range if ETF flows remain positive, but macro uncertainty remains.
This kind of consolidation allows the market to absorb profit-taking before determining a new direction.
Bearish Scenario
The bearish scenario strengthens if Bitcoin:
- Lost $65,000.
- Closing the four-hour chart below $64,992.
- Falling below the 20-day SMA and 50-day SMA.
- Experiencing ETF outflows.
- Facing continued increases in oil prices.
- Pressured by weakening technology stocks.
The next downside targets are around $63,455, $62,375, and $61,295.
To monitor Bitcoin prices, ETF movements, and the latest crypto market developments, you can register at Bittime and follow regular news updates. Use market analysis as a consideration and tailor each decision to your personal risk profile.
Read also:America's Bitcoin Dominates Global BTC, What Impact Will This Have on the Crypto Market?
Conclusion: Will Bitcoin Break $67,000?
Bitcoin still has a chance to break through $67,000, but the market needs stronger confirmation.
The current price remains supported by technical recovery, positioning above the 20- and 50-day SMAs, and continued positive ETF inflows. However, resistance at $66,950–$67,000, rising oil prices, inflation risks, and technology market uncertainty pose major obstacles.
A daily close above $67,000 could open up opportunities towards $67,300, $68,000, and the $70,000 area. Conversely, a loss of $64,992 could take BTC back to $63,455 or lower.
The most objective conclusion is that Bitcoin hasn't failed permanently, but a breakout isn't confirmed either. Traders should wait for the closing price, volume, and market reaction to macro conditions before making a decision.

Bittime is a licensed and regulated Digital Financial Asset Trader (PAKD) supervised by Indonesia’s Financial Services Authority (OJK) — where you can buy Bitcoin in Indonesia and hundreds of other crypto assets starting from just Rp10,000. The registration process is fast, secure, and you can get started today.
Track USDT to IDR conversions and monitor your favorite crypto assets in real time. Everything is available in one crypto investment app that you can download for free on the Play Store
Ready to start? Register now on Bittime and execute your investment strategy with a platform trusted by millions of users in Indonesia.
FAQ
Why did Bitcoin fail to break $67,000?
Bitcoin faces strong resistance, profit-taking, rising oil prices, and uncertainty over tech earnings. ETF flows remain positive, but not yet substantial enough to trigger a breakout.
What is Bitcoin's current resistance?
Major resistance is around $66,950–$67,000. If broken, the next areas to watch are $67,300, $68,000, and $70,126.
What is the nearest BTC support?
Nearest support is around $65,000 and $64,992. If these levels fail to hold, the price could test $63,455 and $62,375.
Why do oil prices affect Bitcoin?
High oil prices can increase inflation and keep interest rates high. These conditions typically reduce investor interest in risky assets like Bitcoin.
Does ETF inflow guarantee Bitcoin will rise?
No. Positive ETF flows can support demand, but prices are also influenced by holder sales, derivatives, macro conditions, liquidity, and market sentiment.
Disclaimer: The views expressed belong exclusively to the author and do not reflect the views of this platform. This platform and its affiliates disclaim any responsibility for the accuracy or suitability of the information provided. It is for informational purposes only and not intended as financial or investment advice.

.png)