Artyfact (ARTY) Price Prediction: New Momentum and Projections for 2025–2030
2025-10-10
Bittime - Artyfact ARTY price predictions are once again being sought after by the crypto community. The ARTY coin token, which is part of a blockchain-based gaming ecosystem, is showing interesting technical patterns amid a recovering market.
To understand the direction of future movements, technical analysis and momentum indicators are important foundations for making predictions that are more realistic and not merely speculation.
An Overview of Artyfact and ARTY Tokens
Artyfact is a blockchain project that combines elements of gaming, NFTs, and token economics with a deflationary mechanism. The ARTY token serves as a means of payment within the game, for staking, and for governance.
The deflationary system implemented causes the token supply to decrease over time, potentially creating a scarcity effect that supports long-term prices.
According to CoinMarketCap data, Artyfact is still in the development stage with relatively small capitalization and trading volume.
The main challenges are expanding the user base, increasing adoption, and competing with other more established GameFi projects.
Read Also: Linea (LINEA) Price Prediction 2025: Between Market Pressure and Long-Term Adoption Potential
Technical Analysis of Charts (MACD & Candles)
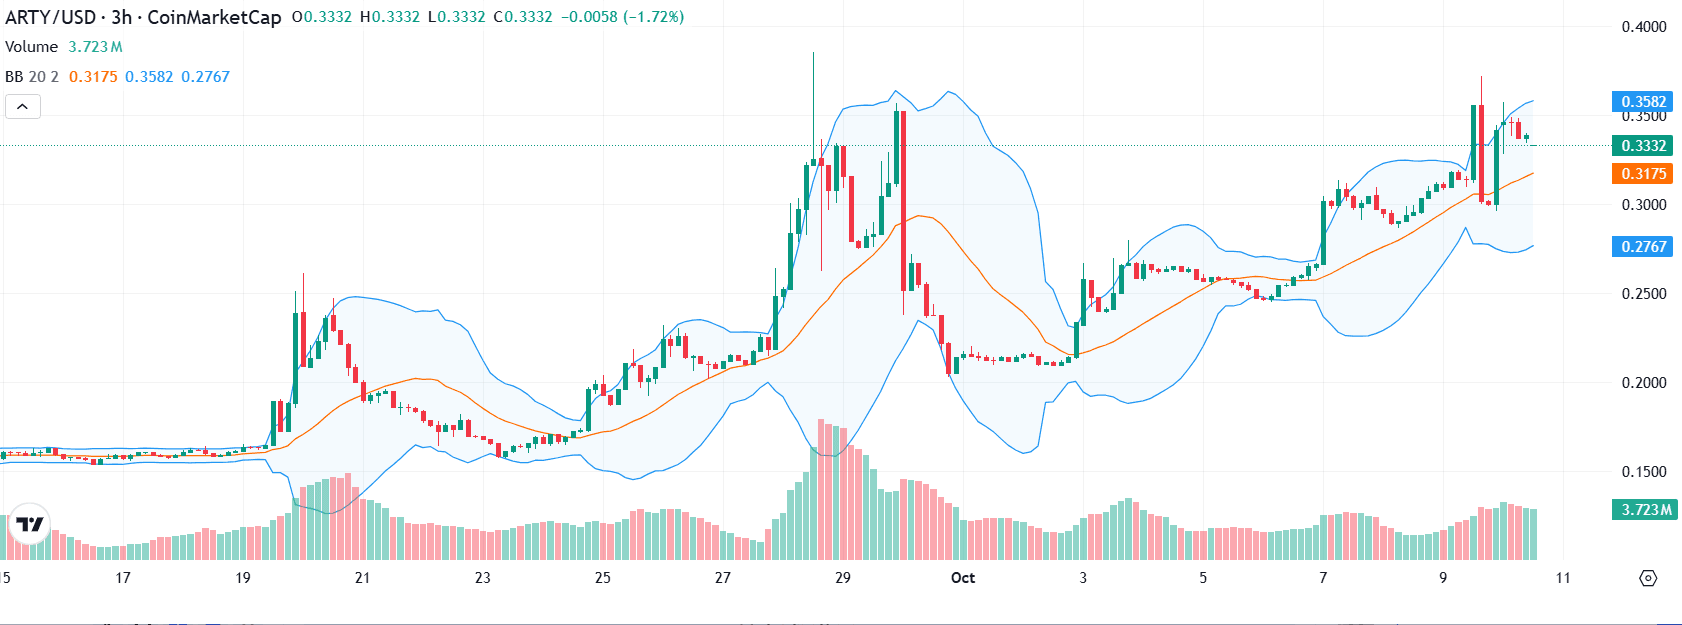
Based on the attached 3-hour chart, several technical signals have emerged:
- MACD shows a potential bullish crossover, where the blue line crosses the orange signal line from below. This could be an indication of early upward momentum.
- The MACD histogram is still thin, indicating that the trend strength is not yet at its maximum, but the direction is starting to be positive.
- The price of ARTY corrected after a surge in high volume, then stabilized in the range of USD 0.33–0.35.
- Volume increases when prices rise — a sign that market participants are becoming active again.
- If resistance at 0.35 is broken with high volume, the chances of continuing the rise to the 0.38–0.40 zone are quite open.
However, if it fails, a pullback to the support level of USD 0.25–0.28 should be anticipated. Technically, the short-term trend indicates healthy consolidation before potential further movement.
Read also: What is Ripple USD (RLUSD)? Check out the tokenomics details!
ARTY Daily Forecast & Short-Term Scenario
On a daily basis, ARTY's movement shows signs of consolidation towards a breakout phase.
- Strong intraday resistance is at USD 0.33–0.35. If it breaks through this zone, the next upside target is at USD 0.36–0.38.
- Strong support lies at USD 0.25–0.28, a zone that previously served as a price rebound point.
- Trading volume is a key indicator — a breakout with high volume can signal confirmation of a new trend direction.
- If the RSI indicator approaches the oversold area (≤ 30), the chances of a rebound increase; conversely, if the RSI > 70, a correction may occur.
Overall, ARTY has the potential to move sideways with a small chance of a breakout in the next 1–3 days. Traders are advised to wait for confirmation of the direction before taking a position.
Read also: LINK Price Prediction 2025–2030: How Will the Price Move?
Weekly ARTY Predictions & Latest Support-Resistance
For the weekly period (the next 3–7 days), the direction of ARTY's price will largely be determined by the reaction in the main resistance zone.
- Weekly resistance: USD 0.35 – 0.40
- Weekly support: USD 0.22 – 0.28
If the price can stay above 0.33 and break through 0.35 with strong volume, ARTY has the opportunity to continue its upward trend towards 0.40 or higher. However, if selling pressure increases again, support below 0.28 will be the last line of defense.
Assuming the global crypto market remains positive, ARTY's realistic weekly price range is between USD 0.30–0.38. This movement could form the basis of a medium-term trend if consolidation is followed by a gradual increase in volume.
Read Also: Dogecoin to $4, Here's the Analysis!
Scenario Summary Table & Critical Zone
ARTY price projection 2025–2030
Based on data from various analysis sites:
- CoinCodex: USD 0,1493–0,2139 (2025)
- Botsfolio: USD 1,18 – 2,28 (2025)
- DigitalCoinPrice:up to USD 1.56 (2030)
- Mexico: USD 0,30 (2025) → USD 0,38 (2030)
- Gate.io:around USD 0.29 – 0.31 (2025)
From these various sources, a realistic and moderate scenario can be estimated:
- End of 2025:ARTY in the rangeUSD 0,25 – 0,35
- 2026–2027:has the potential to rise toUSD 0,40 – 0,60
- 2030:if the gaming ecosystem is successful in growing,ARTY can reach USD 0.80 – 1.60
However, the above figures are still indicative and highly dependent on project adoption, market liquidity, and global sentiment towards the GameFi sector.
Read Also: Zcash Price Prediction 2025: Why Is It Soaring and Where Is It Heading Next?
Supporting factors and determining risks
Supporting factors
- Token deflation mechanism that reduces supply
- Game & NFT integration that strengthens token utility
- Potential new listings on major exchanges
- Positive sentiment of Web3 market
Main risks
- Project adoption is still limited
- Fierce competition between GameFi
- High volatility & liquidity risk
- Regulatory uncertainty
Conclusion
The Artyfact ARTY price prediction shows technical signals that are starting to be positive, especially with the potential for a breakout in the USD 0.33–0.35 range.
On a daily and weekly basis, the price is likely to move between USD 0.25–0.38, while long-term projections place ARTY in the USD 0.80–1.60 range until 2030 if project adoption increases.
However, investors should remain cautious. ARTY is a high-risk asset with high volatility, so capital management and regular analysis updates are highly recommended.
FAQ
Can this prediction be used as a definite reference?
No. All predictions are based on current data and are subject to change depending on market conditions, regulations, and project developments.
When is the best time to enter?
Entry is safer after confirmation of a breakout above strong resistance accompanied by increasing volume.
Can ARTY fall significantly?
Yes. If the project fails to release an update or crypto sentiment weakens, ARTY is vulnerable to a sharp correction.
How often do predictions need to be updated?
Ideally every month or after any major updates such as product launches, new listings, or strategic partnerships.
What indicators are most relevant for ARTY?
MACD, RSI, and volume are the main indicators for measuring trend strength and breakout opportunities.
How to Buy Crypto on Bittime

Want to trade sell buy Bitcoins and crypto investment easily? Bittime is here to help! As an Indonesian crypto exchange officially registered with Bappebti, Bittime ensures every transaction is safe and fast.
Start with registration and identity verification, then make a minimum deposit of IDR 10,000. After that, you can immediately buy your favorite digital assets!
Check the exchange rate BTC to IDR, ETH to IDR, SOL to IDR and other crypto assets to find out today's crypto market trends in real-time on Bittime.
Also, visit the Bittime Blog for interesting updates and educational information about the crypto world. Find reliable articles about Web3, blockchain technology, and digital asset investment tips designed to enrich your crypto knowledge.
Disclaimer: The views expressed belong exclusively to the author and do not reflect the views of this platform. This platform and its affiliates disclaim any responsibility for the accuracy or suitability of the information provided. It is for informational purposes only and not intended as financial or investment advice.

.png)