ZAMA USDT Price Analysis: Trend Remains Bullish but Risk of Correction Increases
2026-07-24
Zama Crypto is at the crossroads between a strong bullish trend and a growing risk of correction.
On July 23, 2026, ZAMA was trading at $0.05 with a daily RSI of 83.38, an overbought level that is historically rare and usually followed by consolidation or a sharp reversal.
The price is also sticking to the upper Bollinger Band, which means if momentum stops, the downside potential to the midline at $0.04 is around 40%.
Although the EMA structure (EMA20 at $0.04, EMA50 at $0.03, EMA200 at $0.03) still indicates a solid bullish trend, the fearful market sentiment (Fear & Greed Index 31) and Bitcoin's dominance above 56.6% add a layer of risk that needs to be watched out for.
Key Takeaways
Zama crypto is trading at $0.05 with a daily RSI of 83.38, a historically overbought level that is usually followed by consolidation or a sharp correction.
Price is sticking to the upper Bollinger Band at $0.05, with a potential downside of around 40% to the midline at $0.04 if momentum stalls.
Technical indicators are still bullish with a neatly structured EMA stack (EMA20, EMA50, EMA200), but market sentiment is fearful (Fear & Greed Index 31).
Daily Technical Structure: Extreme Bullish Trend
Source: AMBCrypto
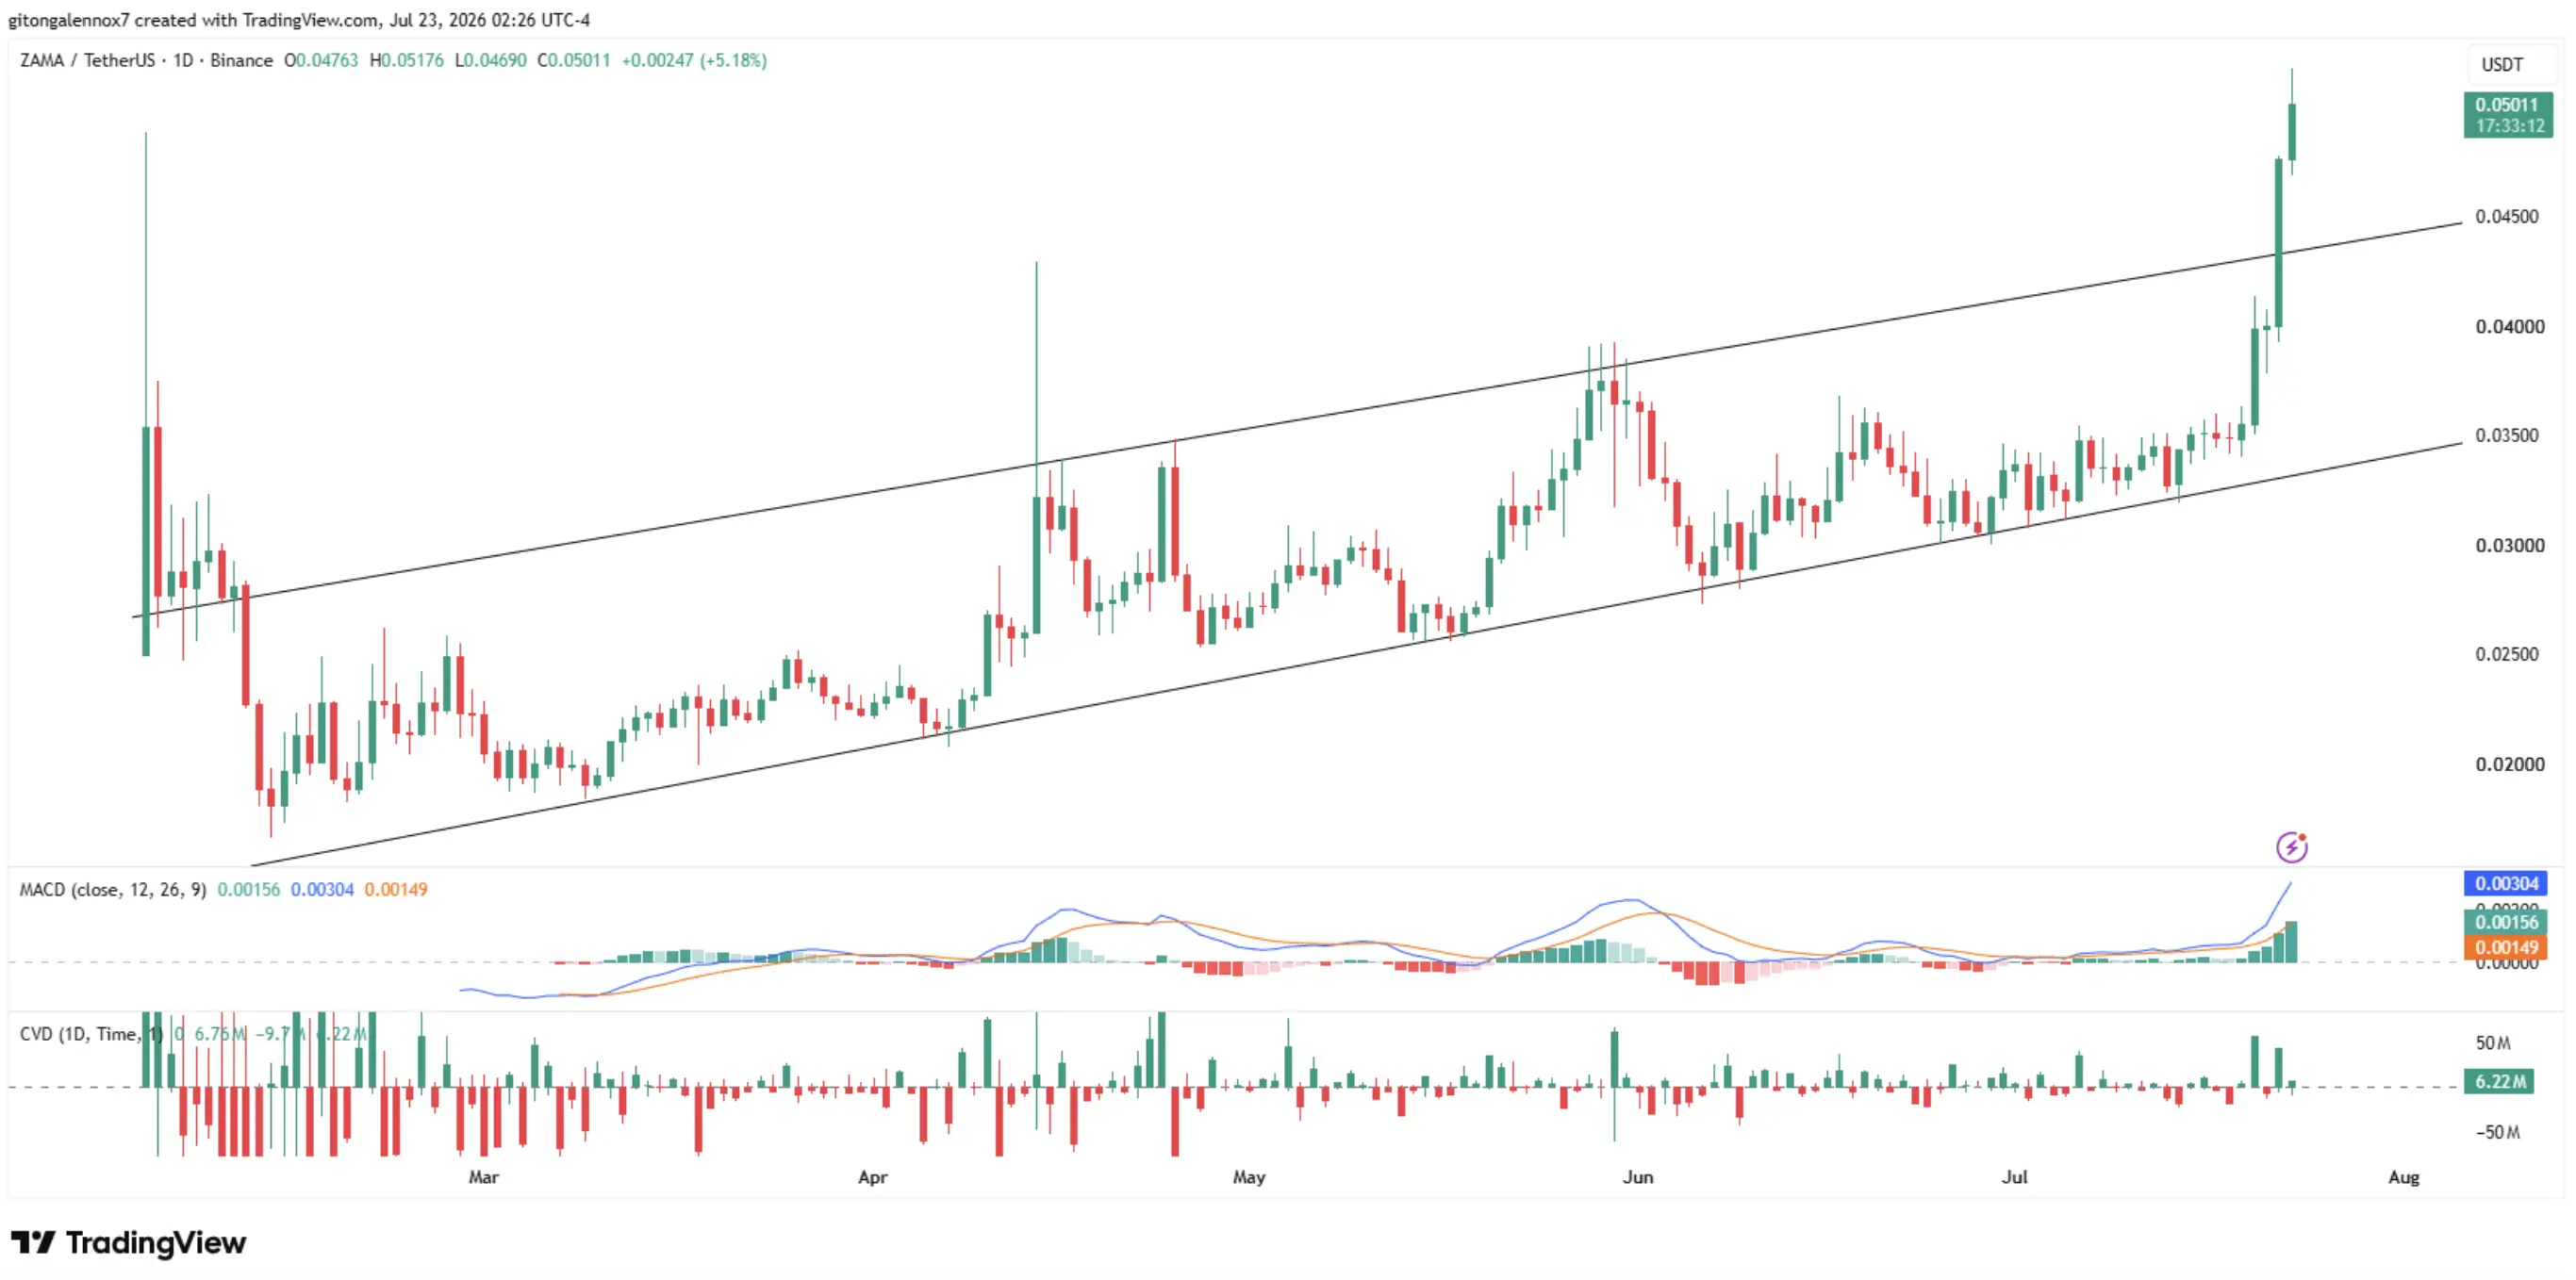
On the daily timeframe, ZAMA exhibits an undeniably bullish structure. Prices are aligned above all three exponential moving averages:
- EMA20: $0,04
- EMA50: $0,03
- EMA200: $0,03
This is the textbook definition of a trending market.
However, the distance between the current price ($0.05) and the EMA200 ($0.03) is quite large relative to the asset's price range, which means that the risk of mean reversion is starting to form even though trend followers have not noticed it yet.
Monitor ZAMA movements and manage your digital portfolio. Register at Bittime, a trusted crypto trading platform in Indonesia
Daily RSI 83.38: Extreme Overbought Signal
The RSI at 83.38 is not simply overbought, it is a historically extreme level for most assets.
Readings above 80 on the daily timeframe are rare, and when they do occur, they are usually followed by sharp consolidation or a rapid reversal.
The challenge is timing: overbought conditions in a trending market can last longer than traders expect.
However, the RSI at 83 indicates that the current move is driven by aggressive buying, and the margin of error for new long entries is very thin.
Read Also: When is the Best Time to Sell Airdrop Tokens?
Bollinger Bands: 40% Downside Potential
Bollinger Bands on the daily timeframe confirm this picture.
The midline is at $0.04, the upper band at $0.05, and the lower band at $0.03. The price is sticking to the upper band, which is normal in a strong uptrend, but it does mean there's a potential downside of around 40% to the midline if momentum stalls.
A close back inside the band with strength would be the first structural warning for bulls.
Read Also: Allora Coin Price Today: ALLO Analysis and Prospects
Signals from Shorter Time Frames
Hourly Chart: Momentum Cools
The hourly RSI is at 69.54, still high and technically approaching overbought, but lower than the daily reading.
The price remains above the EMA20 ($0.05), EMA50 ($0.04), and EMA200 ($0.04).
The RSI divergence between the hourly and daily timeframes indicates that buying pressure at the intraday level is not as aggressive as when the daily RSI started pushing towards 83.
Read Also: ZAMA’s Price Potential and How to Buy It
15-Minute Chart: Consolidation Before Next Move
The 15-minute RSI has dropped to 54.03, the neutral zone. All EMAs (20, 50, and 200) have converged at $0.05, and the Bollinger Bands are very tight.
This compression is often a coiling mechanism: price consolidates after a strong move before the next directional push.
Read Also: Converter 1 ZAMA to IDR
Skenario Bullish vs Bearish
Bullish Scenario
The bullish argument is quite straightforward. The EMA stack on all timeframes remains structured, and the price remains above the Bollinger Bands midline.
As long as ZAMA holds above the daily EMA20 at $0.04, the path of least resistance remains to the upside.
A break and hold above $0.05 on the daily timeframe, confirmed by the hourly RSI recovering from 69 and breaking through 75 with volume, would indicate the next leg of the trend.
Bearish Scenario
A bearish argument doesn't require a catastrophe, just gravity. A daily RSI above 83, combined with a price within the upper Bollinger Band and a Fear & Greed Index of 31, creates a setup where a correction doesn't require an external catalyst.
If ZAMA closes below the EMA20 ($0.04), it will be the first warning that the trend is losing ground.
If it then breaks the EMA50 ($0.03), the bullish thesis will be in serious trouble.
Positioning Strategy
Zama crypto is in a strong uptrend technically, that is an honest assessment.
However, trading with a daily RSI of 83.38 on the long side, against a fearful market backdrop and Bitcoin dominance above 56%, is as much a risk management exercise as it is a directional call.
For those who are already long with a strong entry:
- Consider where to take profit or tighten stop loss
- EMA20 at $0.04 is a logical reference for stop loss
For those considering a new entry:
- Weigh whether the risk-reward at $0.05 (with the upper Bollinger Band as a ceiling and the RSI barely giving room for expansion) justifies the exposure.
- Volatility on compressed Bollinger levels on the 15 minute time frame tends to be underestimated just before it becomes unignorable.
Start trading ZAMA/IDR with Bittime here!
Conclusion
Zama crypto shows a strong bullish trend technically, but the RSI of 83.38 and fearful market sentiment create a significant risk of correction.
Key support levels at $0.04 (EMA20) and $0.03 (EMA50) will determine the next direction.
For investors, this is a moment to strike a balance between capitalizing on momentum and protecting capital from potential sharp corrections.

Now that you understand ZAMA potential, don’t miss out on this trending token and start trading crypto on Bittime!
Bittime is a licensed and regulated Digital Financial Asset Trader (PAKD) supervised by Indonesia’s Financial Services Authority (OJK) — where you can buy Bitcoin in Indonesia and hundreds of other crypto assets starting from just Rp10,000. The registration process is fast, secure, and you can get started today.
Track USDT to IDR conversions and monitor your favorite crypto assets in real time. Everything is available in one crypto investment app that you can download for free on the Play Store
Ready to start? Register now on Bittime and execute your investment strategy with a platform trusted by millions of users in Indonesia.
FAQ
What does RSI 83.38 mean for Zama crypto?
The RSI at 83.38 places Zama in the historically overbought zone. Readings above 80 are rare and usually follow consolidation or a sharp reversal.
Where is Zama's key support level?
The closest and most critical support is the daily 20-day moving average (EMA20) at $0.04. Below it are the 50-day moving average (EMA50) and 200-day moving average (EMA200) at $0.03.
What is the downside potential if momentum stops?
The downside potential to the Bollinger midline at $0.04 is about 40% from the current price of $0.05.
How does market sentiment affect Zama?
The crypto market is generally in the Fear zone (Fear & Greed Index 31) with Bitcoin's dominance above 56.6%, creating headwinds for tokens trying to maintain an aggressive rally.
What is the bullish scenario for Zama?
If Zama stays above the EMA20 ($0.04) and breaks $0.05 with volume, the trend could continue.
What is the bearish scenario for Zama?
A close below the EMA20 ($0.04) would be the first warning, and a break of the EMA50 ($0.03) would jeopardize the bullish thesis.
Disclaimer: The views expressed belong exclusively to the author and do not reflect the views of this platform. This platform and its affiliates disclaim any responsibility for the accuracy or suitability of the information provided. It is for informational purposes only and not intended as financial or investment advice.

.png)