WWAR Price Prediction: Can World War Asset Reserve Break $0.1?
2026-11-04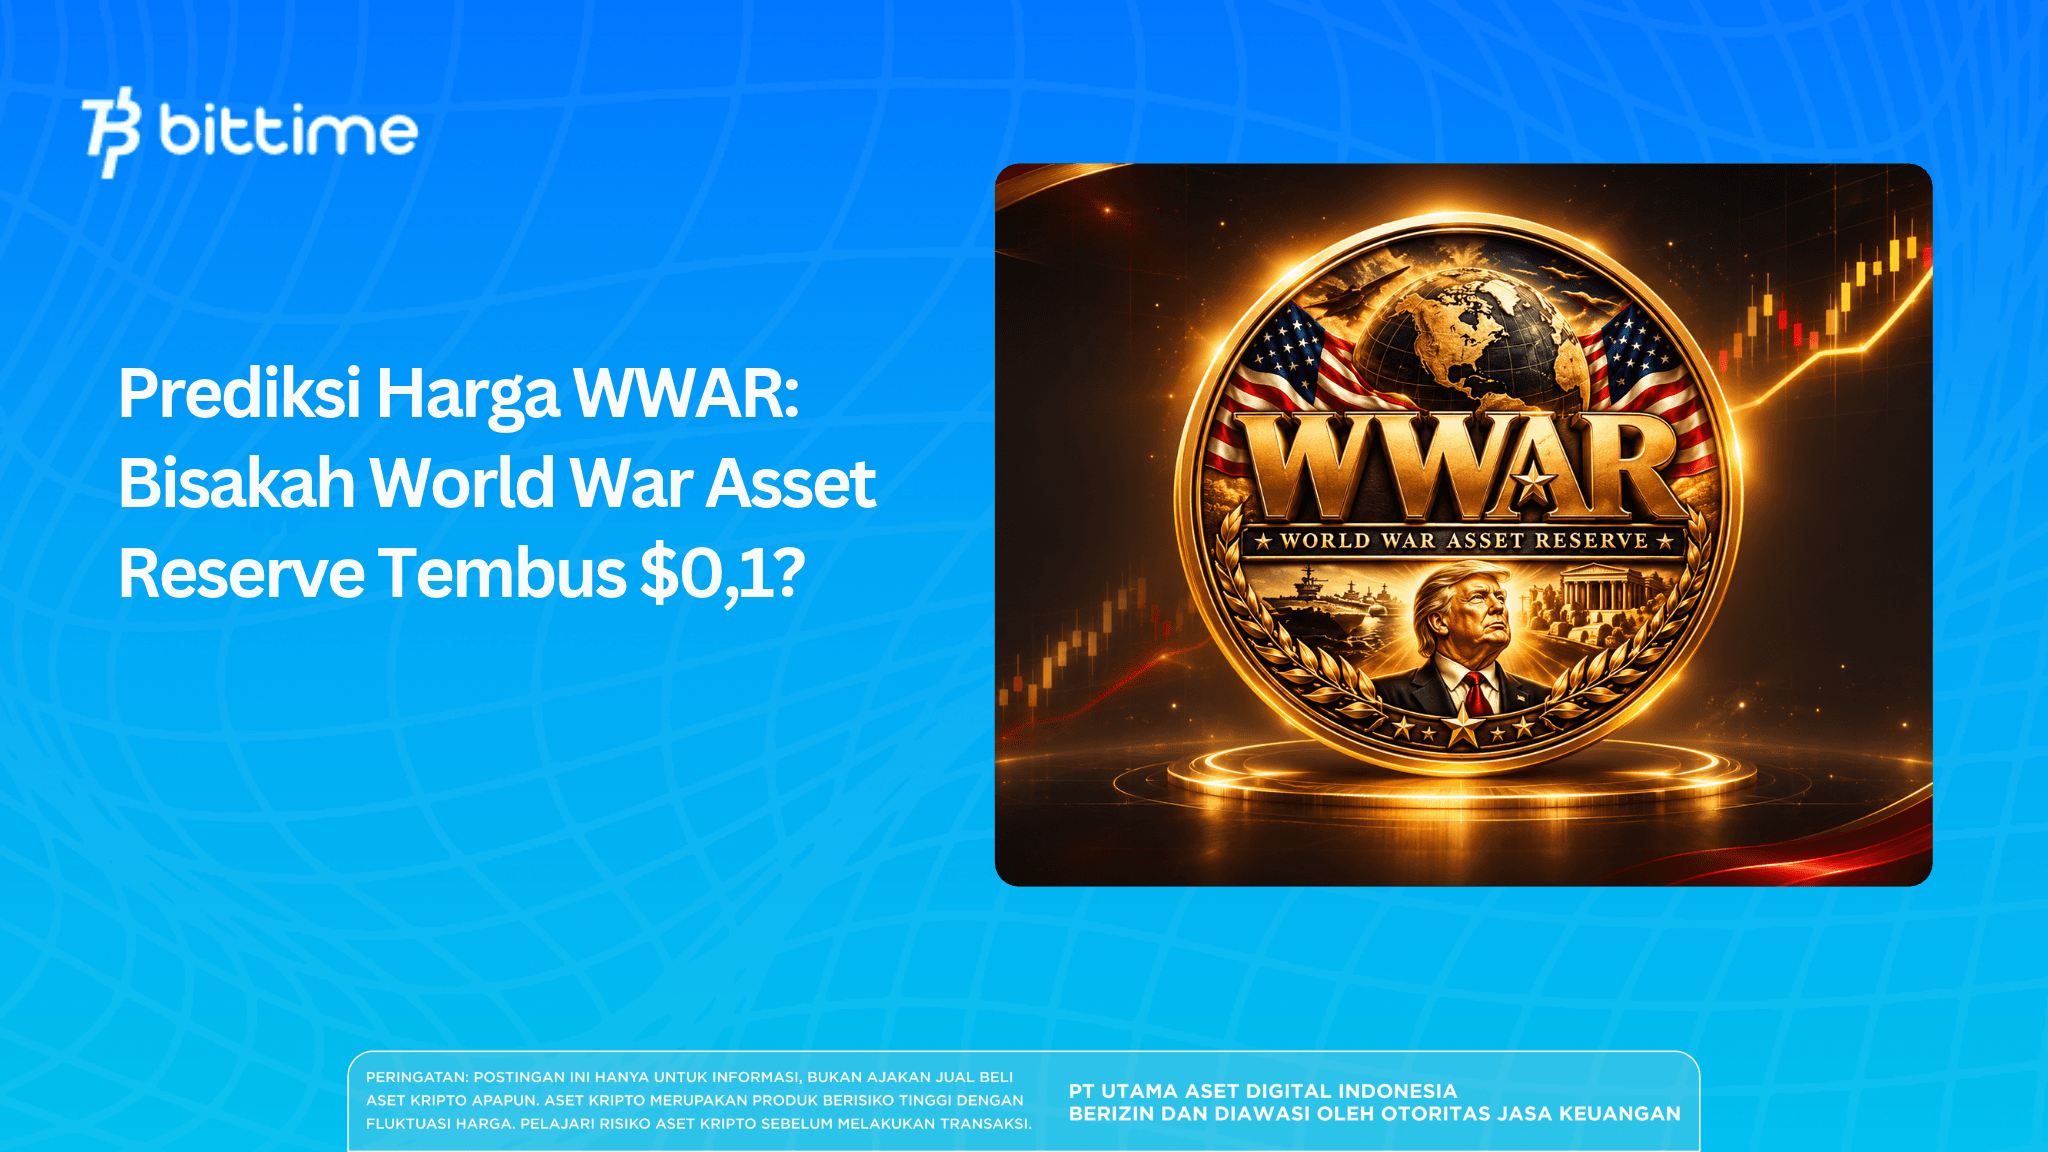
WWAR price predictions have attracted growing attention after the World War Asset Reserve chart on Solana showed a sharp increase. In the WWAR/SOL screenshot analyzed, the price was $0.0002471. From that level, WWAR would need to rise approximately 404.7-fold to reach $0.10—a substantial leap that should not be treated as a price forecast.
But is that target reasonable? A series of green candlesticks alone cannot answer that question. Liquidity, token supply, and the strength of market demand are more important in determining whether a higher price can be sustained rather than appearing only briefly on the chart.
Key Takeaways
- Based on the price shown in the screenshot, WWAR would need to increase approximately 404.7-fold to reach $0.10.
- The recorded supply of approximately 986.38 million WWAR implies a theoretical valuation of $98.64 million at that target price.
- A rising chart alone is not enough to prove that demand and liquidity could support an increase of that magnitude.
What Is World War Asset Reserve (WWAR)?
World War Asset Reserve, or WWAR is a token on the Solana network with a WWAR/SOL trading pair on PumpSwap. The token is listed through Pump.fun, with the following mint address:
Dr24BUPzDZzxeZW9SXu6ctNU8TcHv54bEfPDbyXagaDw
This address matters more than the WWAR symbol. Other tokens can use the same name or ticker, so a price analysis may be misleading if the contract address is not verified first.
At the time of the review, WWAR was still labeled as unverified by certain tracking services. There is no basis for treating the words “Asset Reserve” as evidence of real asset reserves, institutional backing, or any particular intrinsic value.
Also read: Can the XTX Price Reach US$0.10?
What Is the WWAR Price, and What Are Its Market Conditions?
During a market check on November 4, 2026, the WWAR/SOL price was approximately $0.0002440. PumpSwap pair data at that time showed liquidity of around $39,000, 24-hour trading volume of around $36,000, and an indicative market value of around $240,000.
This price differs slightly from the $0.0002471 shown in the screenshot because the data was captured at different times. For consistency, the main analysis below uses the screenshot price to calculate the target; the other market figures provide context from the time of the check, rather than a perfectly synchronized snapshot.
There is an important difference between market capitalization and liquidity. Market value is calculated from the token price and the applicable supply, while liquidity refers to the funds available in a pool to facilitate trades.
WWAR/SOL Chart Analysis: Rapid Growth, but Not Necessarily Stability
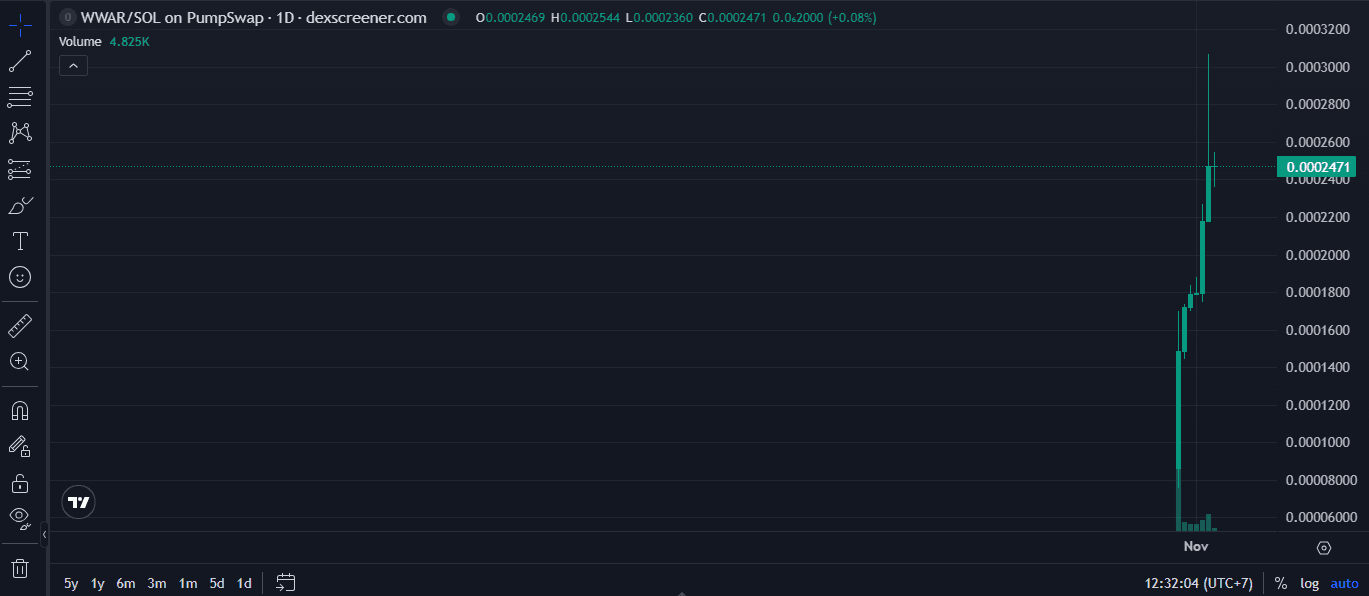
WWAR/SOL chart on the 1D timeframe from the user's screenshot. The image is a snapshot, not a live price chart.
The series of green candlesticks on the chart shows a strong price increase over a short period. However, upper candlestick wicks are also visible, indicating that the price reached higher levels before giving back some of its gains.
The displayed candlestick shows an open of $0.0002469, a high of $0.0002544, a low of $0.0002360, and a close of $0.0002471. The closing price was only slightly above the opening price, even though the candle's trading range was relatively wide.
What does this mean? The market is active and prices can change quickly, but the chart does not yet provide enough historical data to establish a sustained uptrend. The 4.825K volume figure shown by the indicator should also not be equated with daily dollar-denominated trading volume without first checking its units.
WWAR Price Prediction: How Far Away Is the $0.10 Target?
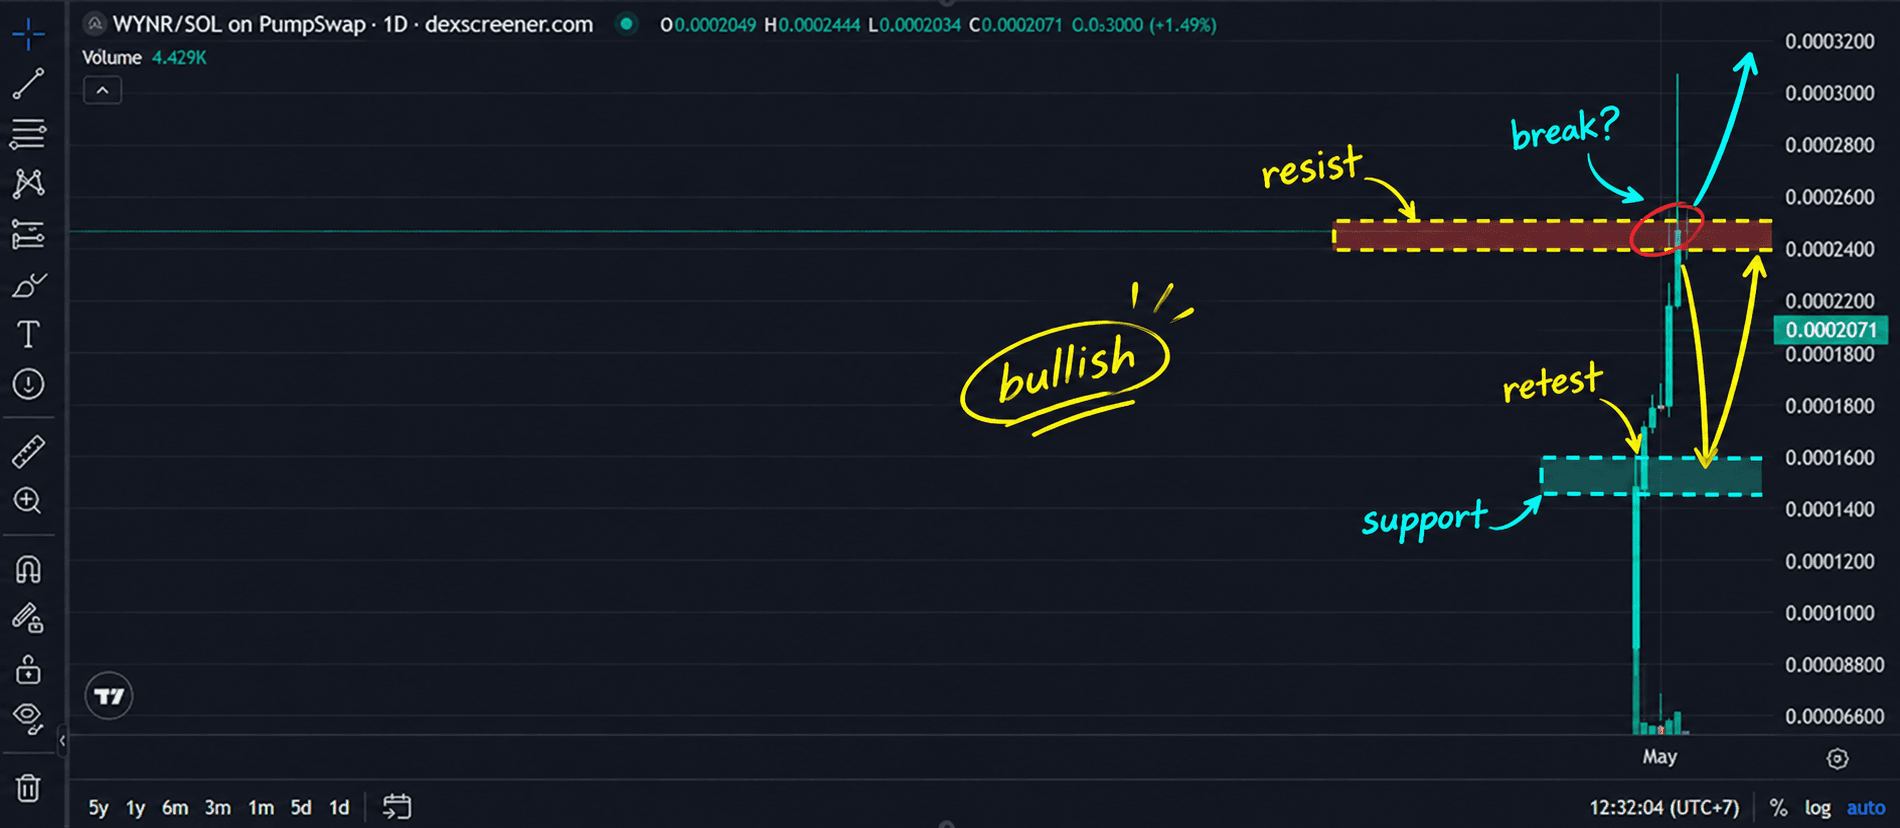
WWAR could mathematically reach $0.10, but the available data does not yet establish whether that outcome is feasible. To understand the gap, first calculate how many times the price would need to increase.
$0.10 ÷ $0.0002471 = approximately 404.69 times
This means the required increase is approximately 40,369% from the price shown in the screenshot. Using the observed price of $0.0002440 instead, the multiple would be about 409.8 times. That is why the starting price should always be stated.
What Would WWAR's Market Cap Be at $0.10?
The on-chain data reviewed recorded a current supply of approximately 986,384,584.67 WWAR. If that entire amount were valued at $0.10 per token, the result would be approximately $98.64 million.
This figure is a valuation simulation based on the recorded supply, not necessarily a verified circulating market capitalization. Market cap uses circulating supply, while fully diluted valuation (FDV) uses the relevant fully diluted supply.
To put the scale into perspective, 1 billion tokens at $0.10 each would have a theoretical value of $100 million. Compared with the indicative market value of only a few hundred thousand dollars at the time of the review, this target would require an enormous change in valuation.
It is also important to remember that an increase in market capitalization does not mean that an equivalent amount of new money must flow into the market dollar for dollar. Prices reflect executed trades, but the ability to sell large amounts of tokens at that price still depends on liquidity depth.
Also read: REMUS Price Prediction: Down 84%—Can It Rebound or Fall Further?
Three Scenarios That Are More Reasonable Than Guessing a Single Price
Bullish Scenario: Buyers Remain Active
WWAR could maintain its momentum if buying activity remains consistent, the liquidity pool deepens, and ownership is not overly concentrated. Verifiable project updates could also help the market assess the token beyond short-term sentiment.
However, that scenario would not automatically take the price to $0.10. A temporary surge needs to be distinguished from genuinely sustainable market growth.
Neutral Scenario: The Price Seeks Equilibrium
After the initial surge, the price could fluctuate without a clear direction. Trading volume may decline as buyers and sellers wait for further developments.
In this situation, attention should focus on liquidity stability and whether the number of market participants is growing, rather than on a single daily candlestick.
Bearish Scenario: Interest Fades More Quickly
Selling pressure from large holders, declining trading activity, or liquidity withdrawals could cause the price to fall sharply. Slippage risk increases when the pool does not have enough depth to absorb larger orders.
Because WWAR has a short trading history, there is not yet a solid basis for assigning probability percentages to these three scenarios.
Also read: XTO Price Prediction: Can It Break $1? The Calculations and Risks
Five Factors That Most Affect WWAR's Price Potential
- Pool liquidity. The thinner the liquidity, the easier it is for trades of a given size to move the price. Monitor changes over time, not just a single reading.
- Sustained trading volume. High volume on a single day does not necessarily mean demand will persist. Compare activity across several periods.
- Token holder distribution. When ownership is concentrated in a small number of wallets, decisions made by a few holders can have a major impact on the market.
- Project transparency. Without verifiable information about the team, utility, or roadmap, fundamental analysis contains significant gaps.
- Solana ecosystem sentiment. Attention toward small-cap tokens can shift rapidly with market trends, so momentum may not last.
These five indicators are more useful when assessed together. A rising price without support from liquidity and broader market participation is much more vulnerable to a reversal.
Also read: PREDICT Token Price Prediction 2026: The Impact of a Futures Listing
WWAR Risks to Consider
Tokens with very low unit prices often appear “cheap,” but whether an asset is cheap or expensive also depends on its valuation and market quality. WWAR faces risks related to high volatility, slippage, concentrated holdings, and limited verifiable project information.
A contract scan that finds no particular issues is not a guarantee of comprehensive security. Likewise, an unverified label does not automatically prove fraud. Rather, it means users should conduct more thorough checks before trusting the project's identity and claims.
To monitor price movements more carefully, use the correct contract address, compare prices observed at the same time, examine pool depth, and check changes in wallet distribution. Do not judge a token solely by a snapshot of green candlesticks.
If you want to follow Solana and other crypto assets, you can sign up for Bittime to read market news and supplement your research before making a decision.
Conclusion
The possibility of WWAR reaching $0.10 is still better viewed as a speculative scenario than as a target supported by strong evidence. Based on the screenshot price, WWAR would need to increase approximately 404.7-fold and reach a theoretical valuation close to $98.64 million for the recorded supply.
The price could still rise, but the sustainability of demand, liquidity, and token transparency will determine the quality of that movement. The $0.10 figure should be tested against data, not presented as a promise of profit.

Bittime is a Digital Financial Asset Trader (PAKD) platform licensed and supervised by Indonesia's Financial Services Authority (OJK) — where you can buy Bitcoin in Indonesia and hundreds of other cryptocurrencies starting from IDR 10,000. Registration is fast and secure, and you can get started today.
Track the conversion of USDT to IDR and real-time price movements of your favorite cryptocurrencies. Everything is available in one crypto investment app that you can download for free from the Play Store.
Ready to get started? Sign up for Bittime now and put your investment strategy into action on a platform trusted by millions of users in Indonesia.
FAQ
Can WWAR Reach $0.10?
Mathematically, yes, but current market data is not sufficient to consider it a realistic near-term target. WWAR would need a very large price increase and a much deeper market for that price to potentially be sustained.
How Much Would WWAR Need to Rise to Reach $0.10?
From the screenshot price of $0.0002471, WWAR would need to rise approximately 404.69 times, equivalent to a gain of around 40,369%. The result would differ if the starting price changed.
What Would WWAR's Market Cap Be at $0.10?
Using 986.38 million tokens as the basis, the theoretical valuation would be approximately $98.64 million. This figure may not equal the actual market cap because the true circulating supply must first be confirmed.
What Factors Affect WWAR Price Predictions?
The most important factors are supply and demand, liquidity, trading volume, holder distribution, and verifiable project information. Momentum in the Solana ecosystem can also influence market interest.
Is WWAR Safe to Invest In?
A rising chart alone provides no basis for declaring a token safe. Check the contract address, verification status, ownership concentration, and liquidity risks before making financial decisions.
Disclaimer: The views expressed belong exclusively to the author and do not reflect the views of this platform. This platform and its affiliates disclaim any responsibility for the accuracy or suitability of the information provided. It is for informational purposes only and not intended as financial or investment advice.

.png)