Bitcoin Demand Hits Extreme Lows: Is BTC at Bottom or Far From It?
2026-06-11
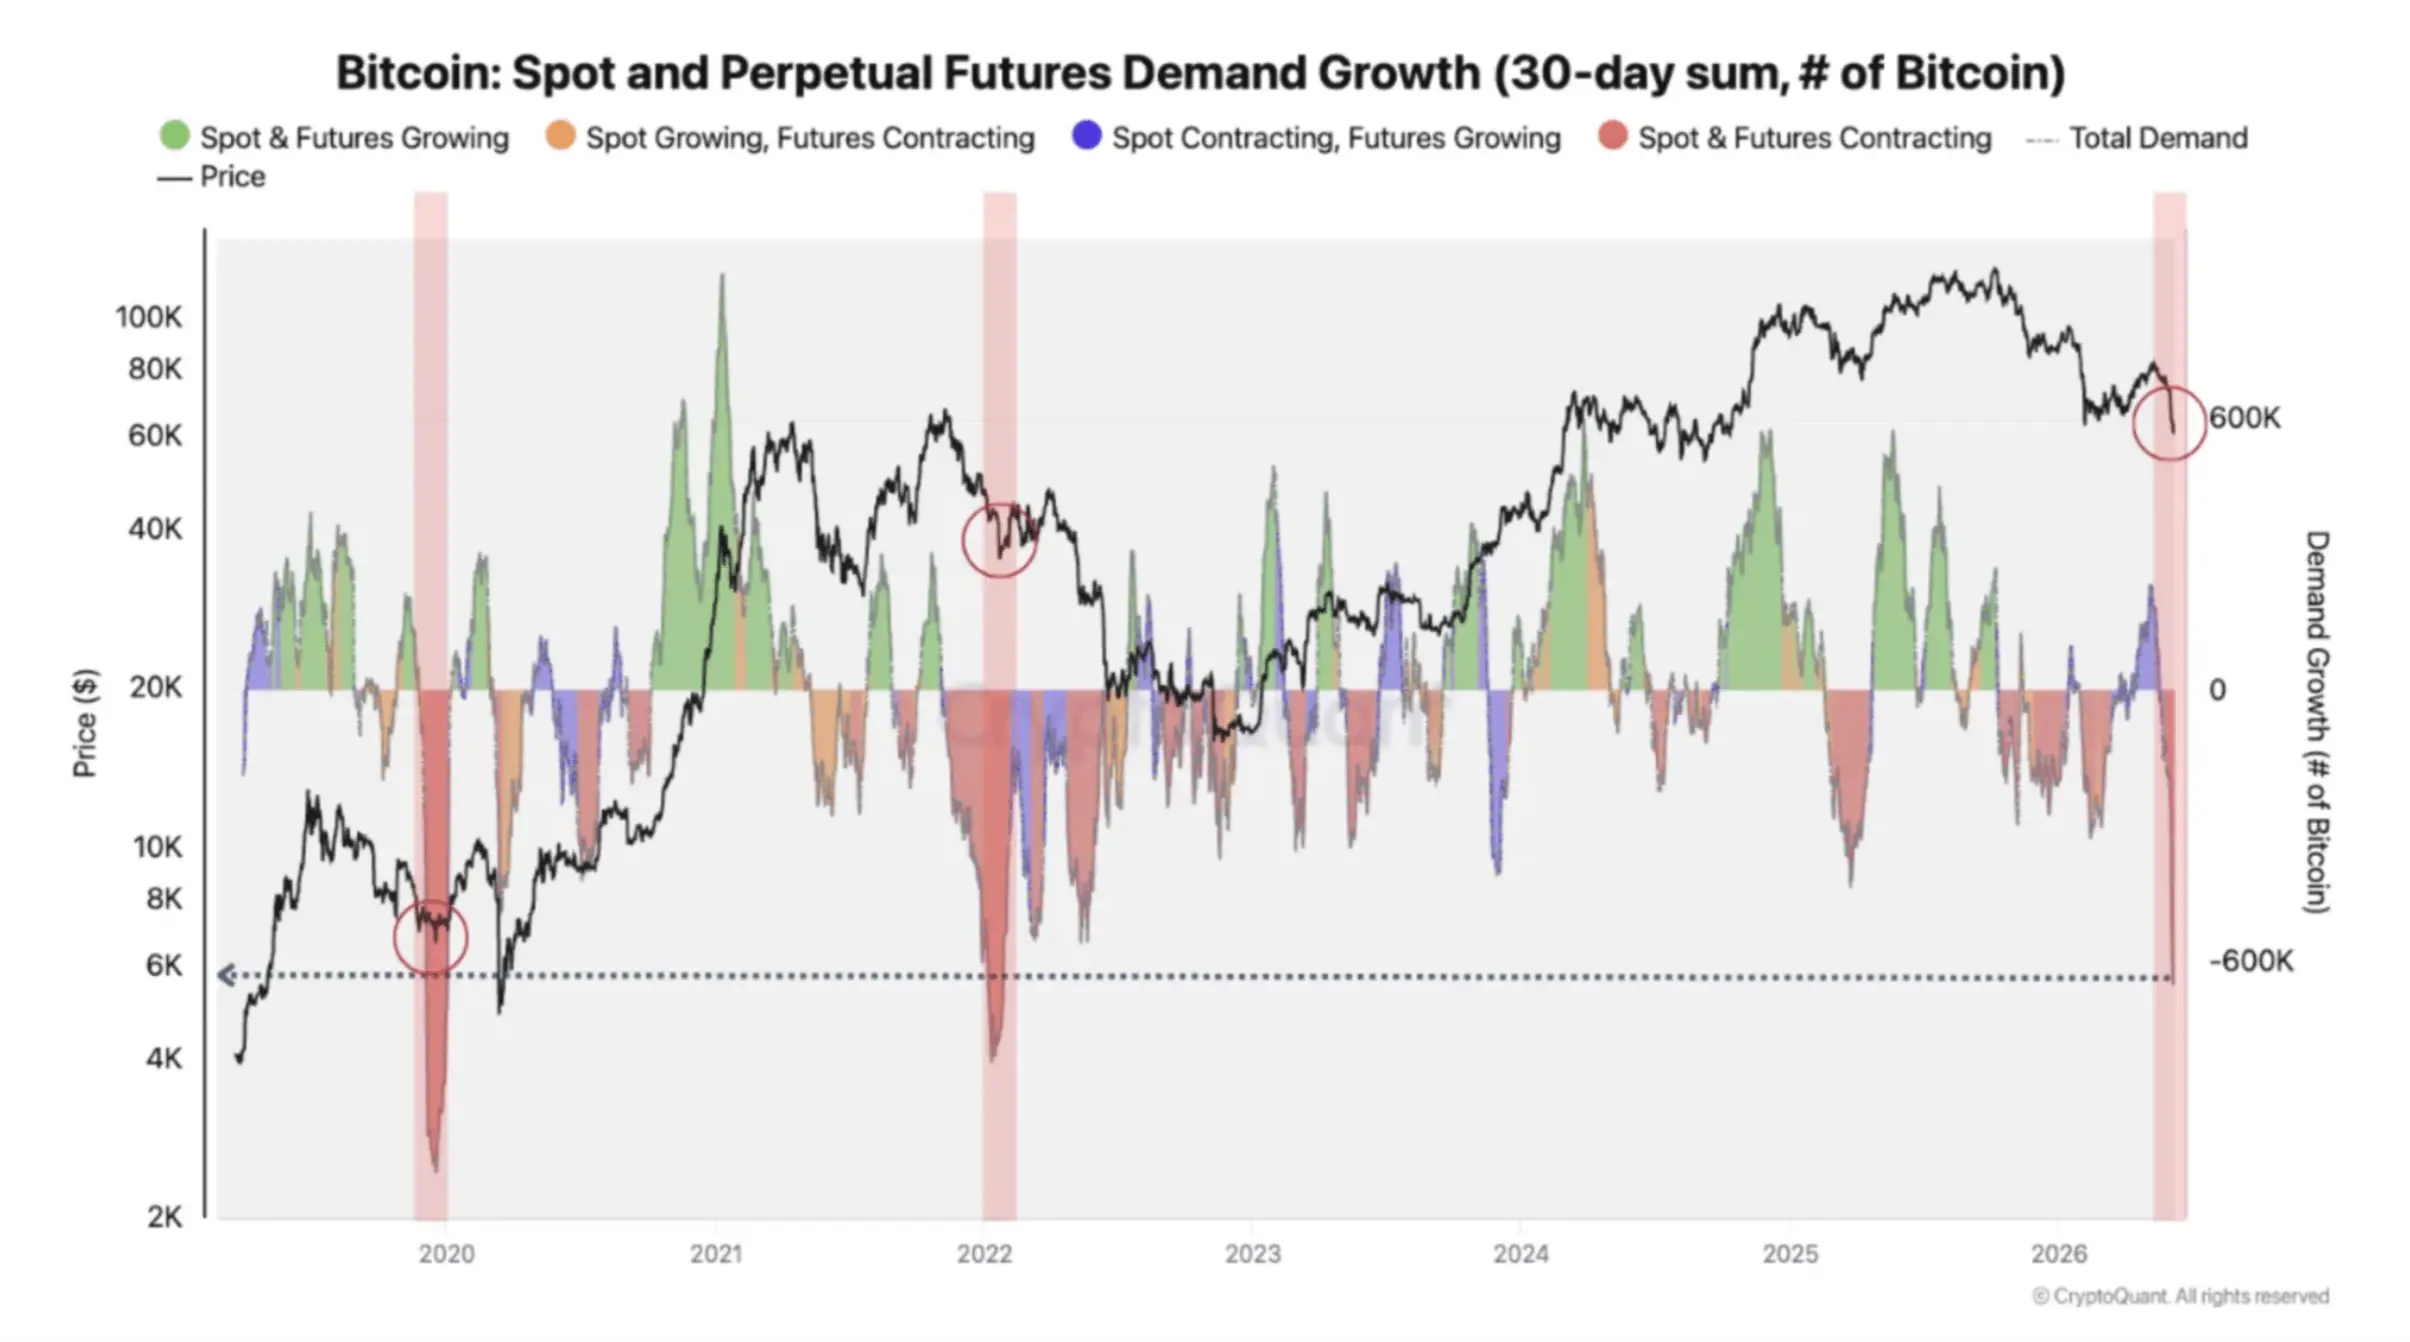
Based on AMBCrypto analysis, the combined growth in demand spot and perpetual futures Bitcoin has dropped to around -650,000 BTC. This level has only been reached three times since 2019.
First, before the March 2020 crash.
Second, during the 2022 bear market. Third, now.
This weakness has now gone beyond leveraged traders and has entered the organic demand structure.
Fewer spot buyers are entering the market, while derivatives exposure continues to shrink. As a result, the market has less capacity to absorb new selling pressure.
Key Takeaways
Bitcoin demand dropped to -650,000 BTC, an extreme level that has only occurred three times since 2019: before March 2020 (crash), during 2022 (bear market), and now.
The CVDD ratio is approaching the bottom threshold of 0.85 (currently 0.73), with a potential bottom zone projected at $52,000-$59,000. The CVDD floor is currently at $46,000.
Liquidity dries up: crypto ETF outflows >$1.8 billion in a week, stablecoin supply drops >$3 billion. Capital is leaving the market, not just rotating out.
Register at Bittime now and start trading crypto with a fast, safe, and easy process in the app.
What Happens When Bitcoin Demand Drops to Extreme Levels?
Historical data suggests that extreme readings like these signal structural exhaustion rather than immediate recovery.
But this does not automatically imply another sharp decline.
Instead, history shows that volatility can expand first, followed by a phase of weak momentum and muted participation.
Read also: Bitcoin Holders Shouldn't Panic, BTC Predicted to Rise Above US$200,000
CVDD Ratio Shows Bottom Approach
CVDD (Cumulative Value-Days Destroyed) is a metric that compares value destroyed over time to price. The CVDD-to-current-price ratio has now risen to 0.73, approaching the historical cycle-bottom threshold of 0.85.
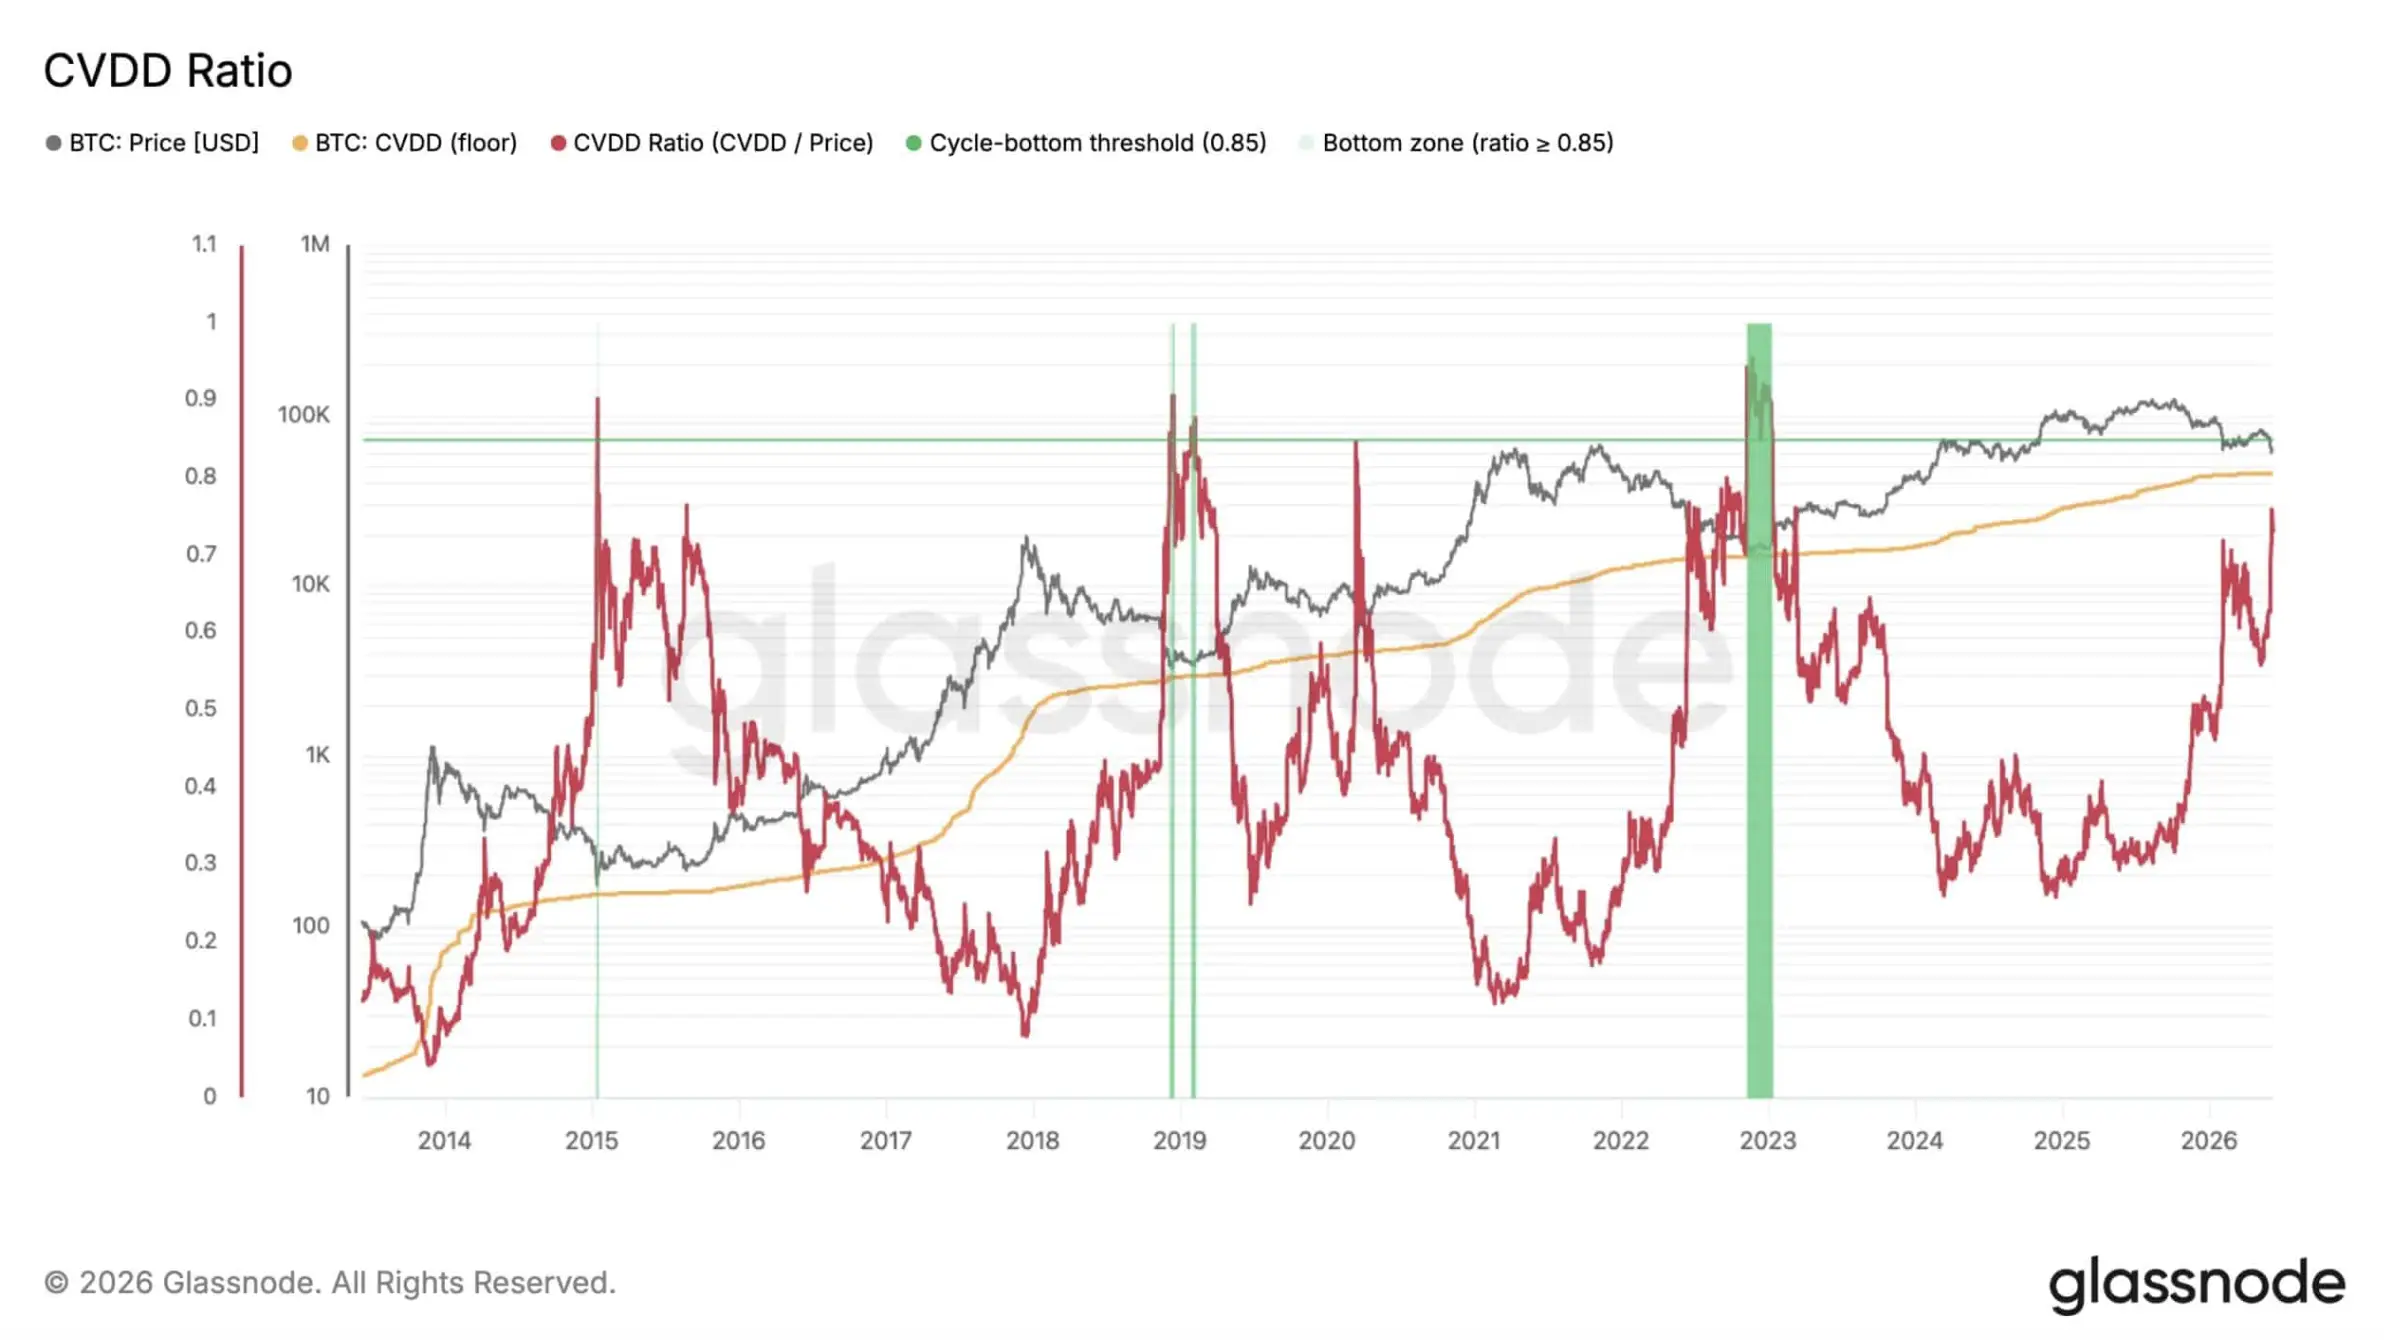
Glassnode data shows a similar pattern in previous bear markets (2015, 2018, and 2022). As the ratio approaches the bottom, prices tend to converge around the CVDD floor.
As of June 9, 2026, CVDD's floor is around $46,000. Historical projections place the potential bottom zone between $52,000 and $59,000.
This means that Bitcoin is approaching an attractive long-term value zone in terms of valuation.
However, demand recovery remains crucial before a durable bottom can form.
Read also: Crypto Trading Strategies When Interest Rates Rise
Liquidity Drying Up Across Crypto Markets
Source: CryptoQuant
The drop of Bitcoin demands in spot and futures market also accompanied by the signal of weakening demand in liquidity indicators.
In the past week, crypto ETFs recorded a net outflow of over $1.8 billion, with Bitcoin accounting for the bulk of the withdrawals.
The latest reading is closer to $1.7 billion, highlighting a sharp shift in institutional positions.
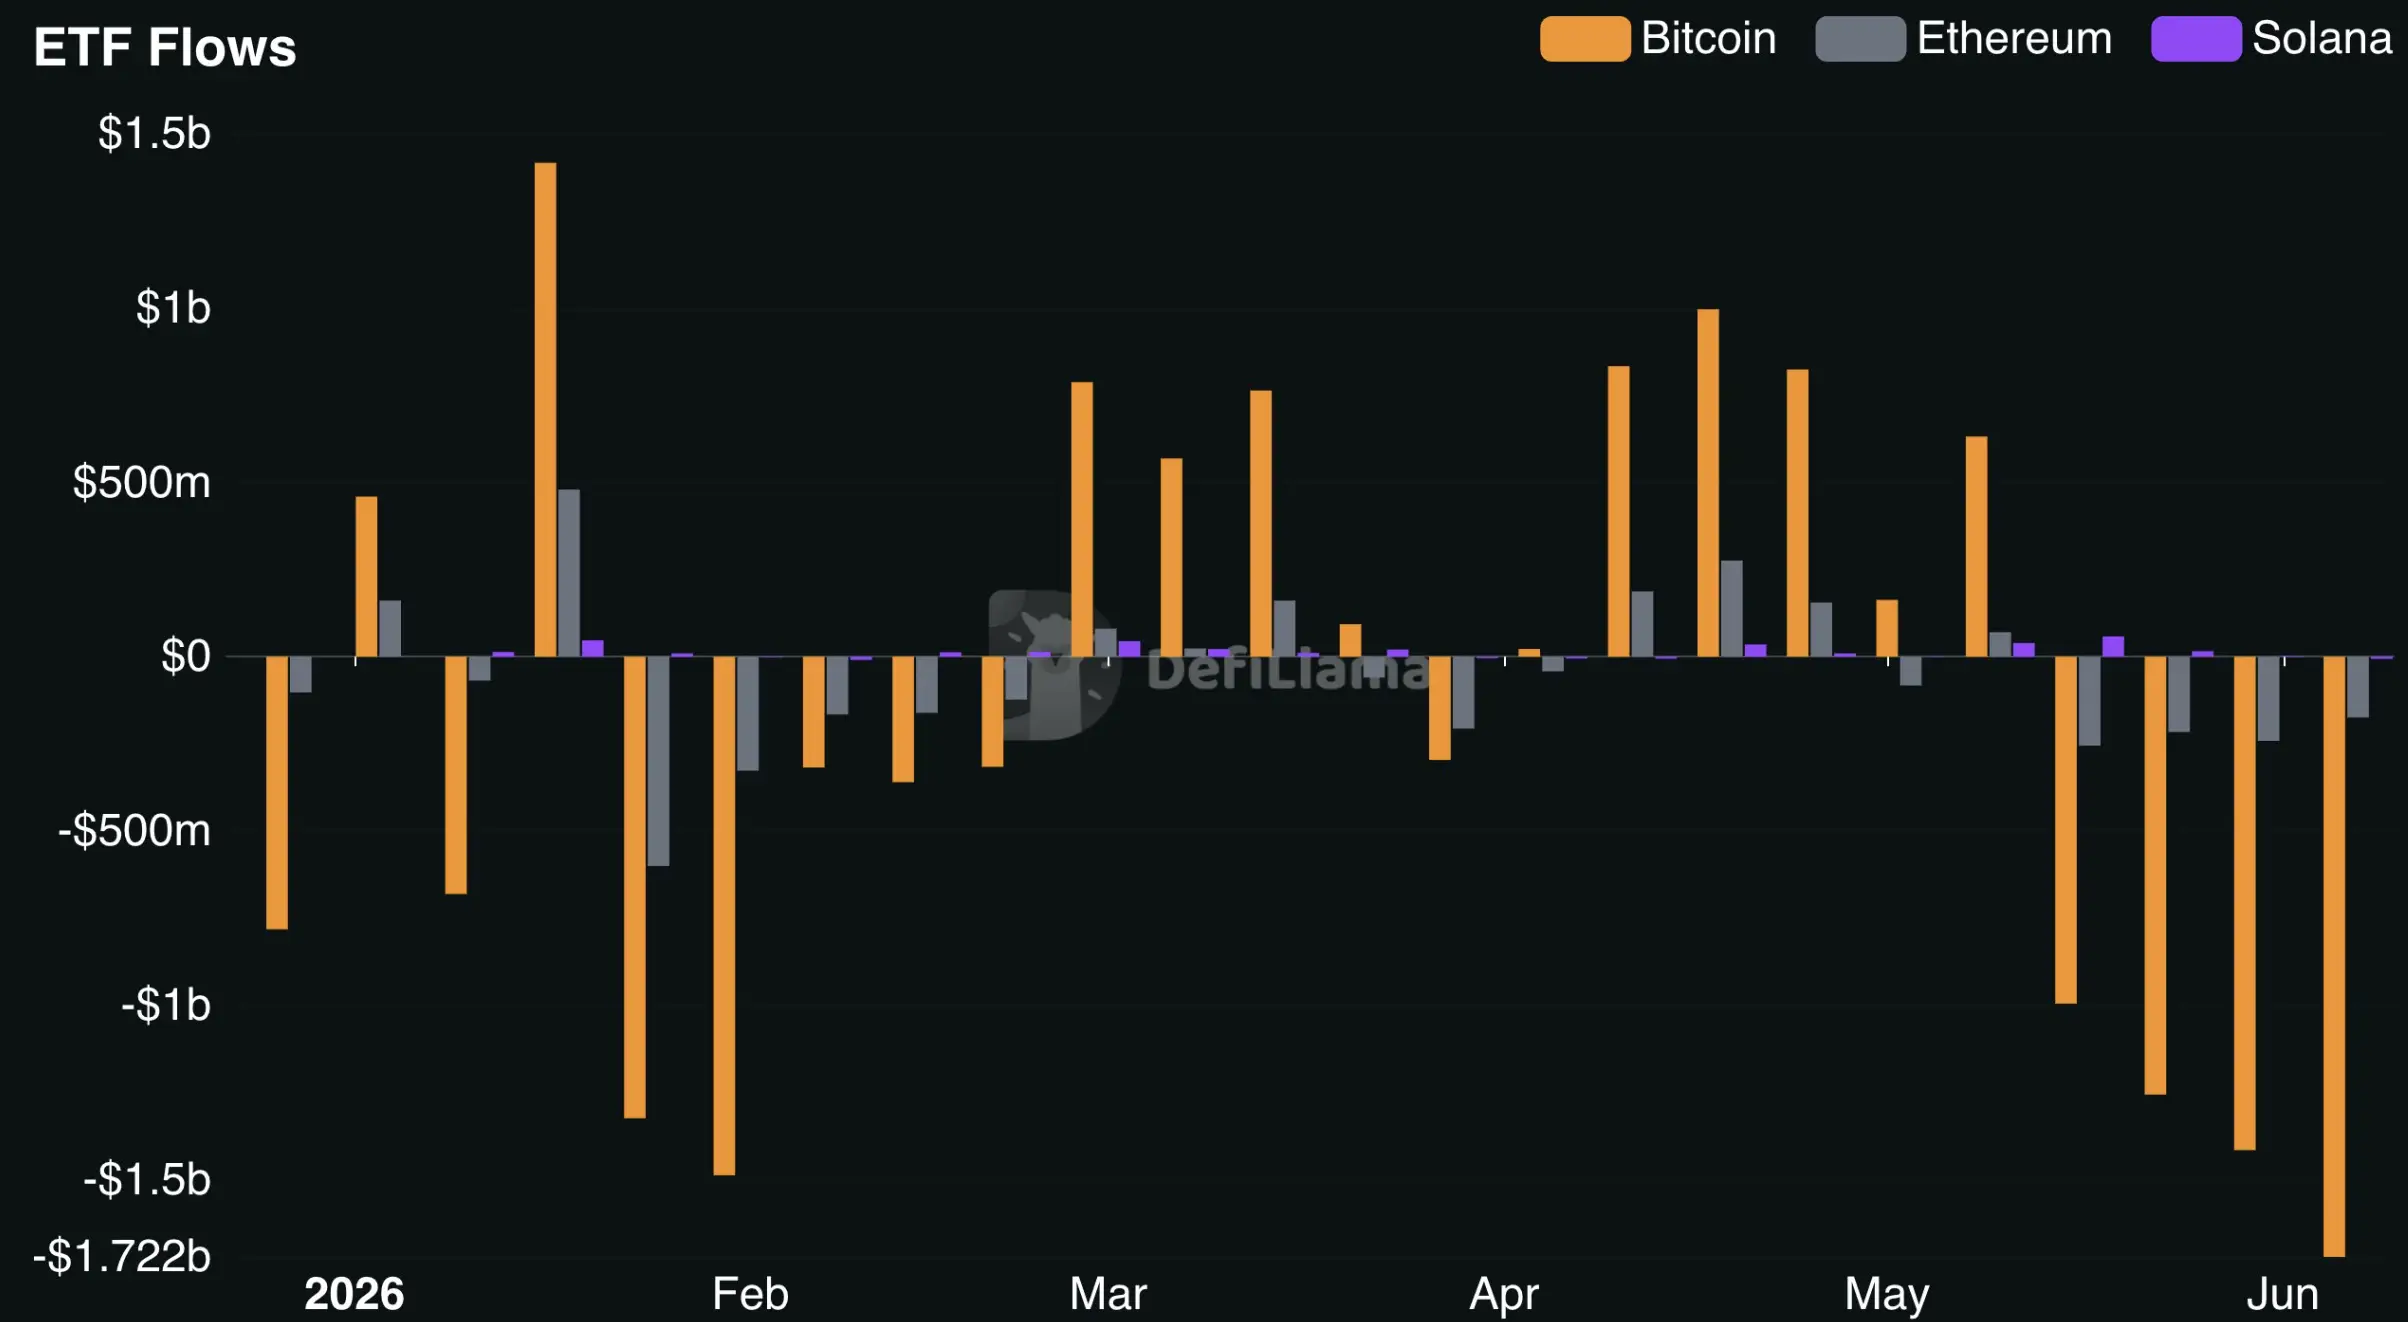
The pressure spread further. The stablecoin supply contracted by more than $3 billion, continuing a negative trend that began in late May.
Together, these flows suggest that capital is leaving the market, not just rotating within it.
This is important because without improved liquidity, risk appetite may remain weak even as valuations become more attractive.
Read also: What is the CFX10 Index? The First Crypto Index in Indonesia
Implications for Traders: Between Attractive Valuations and Continued Risk
Bitcoin is currently at a crossroads between an attractive valuation (heading towards a historical bottom) and a deteriorating demand structure.
Bullish: The CVDD ratio is approaching 0.85, a level that historically marks the bottom of the cycle. The $52,000-$59,000 zone is a potential accumulation area for long-term investors.
Bearish: Demand of -650,000 BTC indicates that there are not enough new buyers to absorb the selling pressure.
As long as demand does not recover from these extreme levels, price action may remain fragile.
ETF outflows of >$1.8 billion in a week and stablecoin contractions of >$3 billion indicate that institutions are still exiting. Without a reversal of these flows, recovery may be delayed.
Read also: Crypto Cards Are Growing Rapidly: A Sign of Expanding Crypto Usage for Shopping?
Conclusion
Bitcoin is approaching an interesting historical value zone, with a CVDD ratio of 0.73 and a projected bottom at $52,000-$59,000.
However, demand dropping to -650,000 BTC (the third extreme level since 2019) and drying up liquidity (ETF outflow of $1.7 billion, stablecoin supply dropping $3 billion) delayed confirmation of the bottom.
Bitcoin remains vulnerable to volatility. Demand recovery and improved liquidity are needed before a lasting bottom can form.

Let’s start trading crypto with the largest assets, such as BTC/IDR and ETH/IDR, right in the Bittime app.
Bittime is a licensed and regulated Digital Financial Asset Trader (PAKD) supervised by Indonesia’s Financial Services Authority (OJK) — where you can buy Bitcoin in Indonesia and hundreds of other crypto assets starting from just Rp10,000. The registration process is fast, secure, and you can get started today.
Track USDT to IDR conversions and monitor your favorite crypto assets in real time. Everything is available in one crypto investment app that you can download for free on the Play Store
Ready to start? Register now on Bittime and execute your investment strategy with a platform trusted by millions of users in Indonesia.
FAQ
What does the drop in Bitcoin demand to -650,000 BTC mean?
This is an extreme level that has only occurred three times since 2019: before the March 2020 crash, during the 2022 bear market, and now. It signals structural exhaustion.
What is CVDD ratio?
Cumulative Value-Days Destroyed is a metric that compares value destroyed to price. A ratio approaching 0.85 has historically marked a cycle bottom.
What is the projection of Bitcoin's bottom zone?
$52,000 - $59,000 based on historical projections. The current CVDD floor is $46,000.
How big is ETF outflow?
Over $1.8 billion in a week, with the latest reading approaching $1.7 billion. Bitcoin accounted for the majority of that.
How much stablecoin supply will drop?
A contraction of more than $3 billion, continuing the negative trend since late May.
Disclaimer: The views expressed belong exclusively to the author and do not reflect the views of this platform. This platform and its affiliates disclaim any responsibility for the accuracy or suitability of the information provided. It is for informational purposes only and not intended as financial or investment advice.

.png)