Is Bitcoin's Bull Run Still Following a Four-Year Cycle? Here's a Signal from the 200-Week Moving Average (MA).
2026-07-13
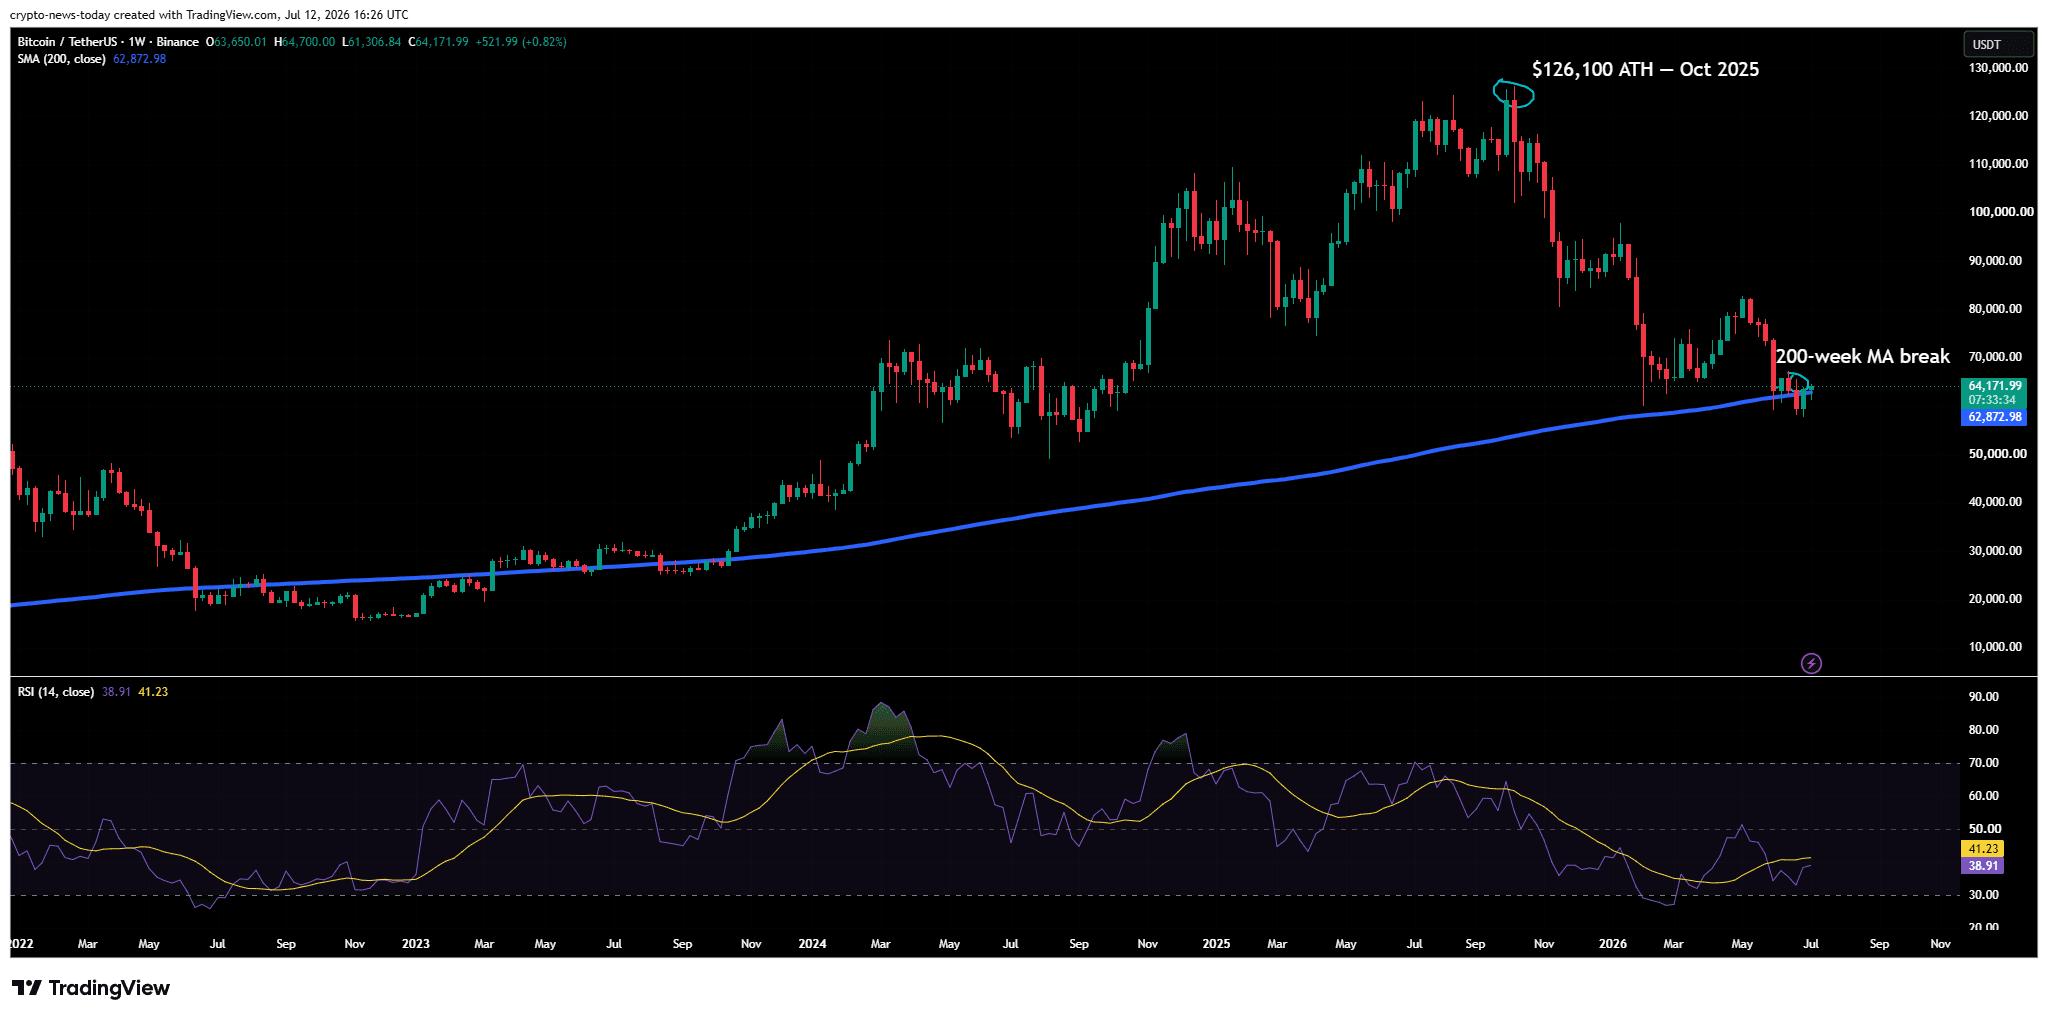
The Bitcoin 4-year cycle pattern is once again being called into question after the BTC price briefly closed below the 200-week moving average in June 2026.
This signal is significant because this indicator has repeatedly served as a market bottom in previous cycles, but current macroeconomic conditions and market structure are not entirely the same as in the past.
Key Takeaways
- Bitcoin still exhibits patterns that resemble four-year cycles, but halvings are not the only factor that determines bull runs and bear markets.
- A weekly close below the 200-week moving average (MA) indicates weakening of the long-term structure, although a single breakout is not enough to confirm a prolonged bearish trend.
- Stronger confirmation needs to come from price, ETF fund flows, global liquidity, realized price, and Bitcoin's ability to re-establish the 200-week moving average as support.
What Is the Bitcoin 4 Year Cycle?
The Bitcoin 4-year cycle is a theory that the Bitcoin market moves in recurring patterns related to halvings.
In this pattern, the market typically goes through a phase of accumulation, price expansion, a bull market peak, a major correction, and then forms a new bottom before the next halving.
A halving occurs after approximately 210,000 new blocks are mined, or roughly every four years. This mechanism cuts the block reward received by miners in half, thereby reducing the rate at which new Bitcoins are issued.
The most recent halving took place on April 19, 2024, and reduced the block reward from 6.25 BTC to 3.125 BTC.

Sumber AI Generated Image
In theory, a reduction in new supply can support price increases if demand remains constant or increases. Miners have fewer new BTC to sell, while investors compete to acquire assets at a lower issuance rate.
However, halving doesn't automatically create demand. Prices remain dependent on capital flows, global economic conditions, regulations, leverage, investor sentiment, and liquidity availability.
Read also: Glassnode Bitcoin Analysis: A Bottom Is In Sight, But a Bull Market Isn't Here Yet
How is the Bitcoin Halving Cycle Pattern Formed?
The first three halvings were followed by significant price increases over the following 12 months. The increase after the 2012 halving was significantly larger than in subsequent cycles, while returns after the 2016 and 2020 halvings showed a downward trend as Bitcoin's market capitalization increased.
This historical pattern supports the idea that Bitcoin experiences recurring market cycles. However, the sample size is very limited. Bitcoin has only experienced four halving events, so statistical conclusions regarding the four-year pattern should be treated with caution.
Cycles aren't just shaped by halvings. Each period has different drivers:
- The initial cycle was dominated by retail investors and crypto exchange adoption.
- The 2017 cycle was supported by a boom in initial coin offerings.
- The 2020–2021 cycle coincided with monetary stimulus and low interest rates.
- The cycle after 2024 is influenced by spot Bitcoin ETFs, treasury firms, institutional derivatives markets, and global liquidity policies.
This change allows the time pattern to remain visible, but the size of the rise, the depth of the correction, and the duration of each phase do not have to be the same.
Read also: Bernstein's $150K Bitcoin Target Remains Despite 54% Pullback
Does Bitcoin's 4-Year Cycle Still Apply?
Some recent market movements still resemble old patterns. Bitcoin reached a record high of around US$126,100 in October 2025, then declined more than 50% from its peak. By mid-July 2026, BTC was trading around US$64,000.
Chronologically, the pattern can still be read as:
- Halving in April 2024.
- Price expansion after halving.
- Market peak in the second half of 2025.
- Major correction in 2026.
- Long term base area testing.
The sequence is similar to the previous cycle. The differences lie in market structure, the depth of the correction, and the influence of institutional investors.
A correction of around 50% is significant, but it's still smaller than the 60% to over 70% declines seen in previous bear markets. One possible cause is institutional demand through ETFs, although these fund flows can also reverse into selling pressure when redemptions occur.
So, the four-year cycle cannot be declared extinct. A more accurate conclusion is that the pattern is still visible, but its influence is now mixed with other, increasingly dominant factors.
Why not start investing in and trading Bittime? Register to Bittime – it’s quick, secure and easy.
What Is Bitcoin's 200-Week Moving Average?
The 200-week moving average Bitcoinis the average weekly closing price of BTC over the past 200 weeks. Since 200 weeks is approximately four years, this indicator covers almost one full halving cycle.
The simple formula is:
200-week MA = total closing prices of the last 200 weeks ÷ 200
This indicator moves slower than a short-term moving average. Its purpose is not to predict daily price changes, but rather to help investors discern the direction of structural trends by reducing the interference of short-term volatility.
When prices are well above the 200-week moving average (MA), the market is generally in a strong long-term trend. As prices approach this indicator, investors begin to assess whether the area will act as support.
If the price breaks below, the 200-week moving average could turn into resistance. This indicates that the average buyer for nearly four years is facing greater pressure.
Read also: Strategy: Selling 3,588 Bitcoins Worth $216 Million: Is Saylor's Treasury Model Under Threat?
Why is the 200-Week MA Important for the Bitcoin Market Cycle?
The 200-week moving average (MA) has a reputation as one of the fundamental indicators of the Bitcoin market.
During the 2015 and 2018–2019 bear markets, the price held or formed a base around this indicator. Bitcoin also briefly broke through it during the global market panic in March 2020.
In June 2022, Bitcoin fell again below the 200-week moving average. It then took a long time for the price to more convincingly reclaim the indicator in October 2023.
Historical patterns don't necessarily mean the price will immediately rebound. In some cases, Bitcoin can:
- Traded below the indicator for several weeks.
- Retesting the 200-week MA as resistance.
- Moving sideways in a long accumulation phase.
- Experiencing a false breakout before the trend direction is formed.
- Drop to other on-chain indicators if support fails.
The 200-week moving average's track record looks strong, but it's based on only a few cycles. The indicator should be used as an analytical tool, not a magic number that always marks the lowest price.
Read also:The US Strategic Bitcoin Reserve is Hampered, What's Going On?
What Does It Mean When Bitcoin Falls Below the 200-Week MA?
Bitcoin recorded a close below its 200-week moving average in June 2026, the first time since the previous bear market. The indicator hovered between US$59,000 and US$61,000 and continued to rise as new weekly price data came in.
This breakthrough resulted in two main interpretations.
First Scenario: Price is Forming a Bottom
In a bullish scenario, a drop below the 200-week MA represents capitulation, or the phase when selling pressure begins to reach saturation point.
If BTC closes above the indicator again and maintains it for several weeks, the market could interpret the move as a reclaim. A reclaim accompanied by increased volume and inflows would strengthen the suspicion that a cycle bottom is forming.
Scenario Two: The Bear Market Isn't Over Yet
In a bearish scenario, a rise back above the 200-week moving average would only serve as a relief rally. Prices could be rejected again and fall towards lower support.
A single close below the indicator isn't enough to confirm this pattern. However, repeated failures to reclaim the US$59,000–US$61,000 area could indicate that selling pressure isn't completely over.
In 2022, Bitcoin recorded dozens of weekly closes below this indicator. The 2026 conditions haven't lasted nearly as long, so the sample size is still too short to draw any definitive conclusions.
Read also: America's Bitcoin Dominates Global BTC, What Impact Will This Have on the Crypto Market?
Is Bitcoin's Bull Run Still Going After the Halving?
Halvings remain relevant because they directly reduce new BTC issuance. After the 2024 halving, theoretical production drops from around 900 BTC to around 450 BTC per day before accounting for block time variations.
However, the impact of these supply changes is negligible compared to the overall size of the Bitcoin market. The trading volume of ETFs, treasury companies, whales, and derivatives markets can significantly outweigh the daily supply of miners.
The next bull run is likely to be determined not only by the months following the halving. Potentially more dominant factors include:
- Bitcoin ETF spot inflows and outflows.
- Central bank interest rate policy.
- Growth or contraction of global liquidity.
- The strength of the United States dollar.
- Corporate demand for Bitcoin reserves.
- Stock market conditions and risk assets.
- Miner sales.
- Liquidation of leveraged positions.
- Digital asset regulation.
Halvings still serve as a foundation for supply. However, the timing of a bull run is largely determined by the interaction of supply with demand and liquidity.
Convert 1 BTC to IDR - Bitcoin to Indonesian Rupiah Exchange Rate
Does the 200-Week MA Signal a New Bull Run?
Not necessarily. The 200-week MA is better suited to assessing the underlying market structure than directly predicting the start of a bull run.
A new bull run requires some form of confirmation:
1. Weekly Close Holds Above 200-Week MA
The price shouldn't just break through the indicator in one week. Bitcoin needs to maintain that area as support for the next few weekly closes.
2. Higher Low Formed
After a rebound, the next correction needs to stop above the previous low. The higher low structure indicates that buyers are starting to be willing to enter at higher prices.
3. ETFs Return to Record Consistent Inflows
ETF inflows could indicate that institutional investors are reacquiring supply. Conversely, sustained outflows could weaken positive technical signals.
4. Prices Return Above Short-Term Holder Cost Basis
The short-term cost basis for holders is around US$69,000 as of mid-July 2026. As long as prices remain below this level, many new buyers will still experience unrealized losses and could become a source of selling pressure.
5. Liquidity and Volume Improve
A rise without sufficient volume is more susceptible to reversal. A healthy bull run is typically accompanied by increased spot volume, order book depth, and demand that stems not solely from leverage.
Read also: Bitcoin in July: Historically, It's Often Rising, But This Time Something's Different
What Happens If the 200-Week MA Fails to Hold?
If Bitcoin falls below the 200-week moving average again, investors can monitor the aggregate realized price. This indicator represents the average price at which each BTC last changed hands.
The aggregate realized price is around US$54,000–US$54,900. Below that, the realized price of long-term holders is around US$49,700, which could provide deeper support.
These levels are not definitive price targets. Investors should treat them as analysis zones.
A decline towards the realized price area could indicate that most holders are beginning to experience unrealized losses. This situation has occurred near the bottom of a bear market, but the market can remain in a weak phase for extended periods.
Read also:US Vice President J.D. Vance Apparently Holds IDR 4 Billion in Bitcoin
Can Bitcoin's Cycle Change Permanently?
Yes, the character of the cycle can change as the market evolves.
Spot Bitcoin ETF this allows investors to gain exposure without directly holding BTC. Futures and options markets allow institutions to hedge. Public companies are also starting to use Bitcoin in their treasury strategies.
These developments increase liquidity and market access, but they also strengthen Bitcoin's ties to the traditional financial system. Changes in interest rates, bonds, the dollar, and stock market sentiment can now impact BTC more rapidly than in earlier cycles.
The impacts can be:
- Cycles become longer or shorter.
- Corrections become shallower but more frequent.
- Price peaks form before or after historical timeframes.
- Halving has a smaller marginal impact.
- Macro factors are becoming more dominant.
- Prices move in a long range before a new trend emerges.
The pattern change doesn't mean the halving has lost its function. Bitcoin's supply remains subject to the protocol's rules. What can change is the market's response to the supply reduction.
Strategies for Facing the Bitcoin Market Cycle
Investors should not make decisions solely based on the belief that Bitcoin will definitely go up every four years.
Some more measured approaches include:
- Use the 200-week MA as a zone, not a single price.
- Monitor weekly closes, not just intraday movements.
- Compare the price with the realized price and cost basis holder.
- Check ETF fund flows as well as spot market volumes.
- Avoid excessive leverage when volatility increases.
- Determine your risk limits before purchasing.
- Use incremental purchases if the investment thesis is long-term.
- Re-evaluate the thesis as market structure changes.
To stay up-to-date on Bitcoin prices, market data, and the latest digital asset news, you can register with Bittime. Use each analysis as additional research and tailor your decisions to your individual goals and risk tolerance.
Conclusion
Bitcoin’s 4-year cycle remains relevant because price movements following the 2024 halving continue to follow the historical pattern: expansion, peak, correction, and testing of long-term support.
However, this cycle is not a market law. The presence of ETFs, institutional investors, corporate treasuries, the derivatives market, and macroeconomic factors has made Bitcoin’s price movements increasingly complex.
A close below the 200-week MA in June 2026 serves as a warning signal, but it is not yet sufficient to declare that the long-term structure has been broken. Further confirmation depends on Bitcoin’s ability to reclaim that indicator as support.
If the price manages to hold above the 200-week MA, form a higher low, and receive support from ETF inflows, the likelihood of a bottom forming will strengthen. If it fails, the realized price zone around US$54,000 could become the next area of focus.
Investors do not need to choose absolutely between “the cycle is still valid” or “the cycle has ended.” A more rational approach is to view the cycle as a probabilistic framework and then confirm it using price data, on-chain metrics, capital flows, and economic conditions.

Bitcoin is now available and ready for trading on Bittime via the BTC/USDT pair; in addition, there are other assets on the Bitcoin BRC20 network, such as SATS and ORDI.
Bittime is a licensed and regulated Digital Financial Asset Trader (PAKD) supervised by Indonesia’s Financial Services Authority (OJK) — where you can buy Bitcoin in Indonesia and hundreds of other crypto assets starting from just Rp10,000. The registration process is fast, secure, and you can get started today.
Track USDT to IDR conversions and monitor your favorite crypto assets in real time. Everything is available in one crypto investment app that you can download for free on the Play Store
Ready to start? Register now on Bittime and execute your investment strategy with a platform trusted by millions of users in Indonesia.
FAQ
Does Bitcoin's four-year cycle still apply?
The pattern is still visible, but it doesn't guarantee price movements at the same time or percentage. ETFs, global liquidity, and institutional investors now have greater influence.
What is the Bitcoin 200-week moving average?
The 200-week moving average (MA) is the average of Bitcoin's weekly closing prices over the past 200 weeks. This indicator is used to identify long-term trends and key support and resistance areas.
Does a price below the 200-week MA mean Bitcoin is bearish?
A downside breakout indicates pressure on the long-term trend, but it doesn't necessarily confirm a bear market. The duration of the breakout and the price's ability to reclaim it are more important than a single short move.
Does a Bitcoin bull run always happen after a halving?
Historically, halvings have been followed by significant gains, but the sample size is limited. Bull runs still require demand, liquidity, and favorable market conditions.
What indicators should be monitored besides the 200-week MA?
Investors can monitor realized prices, short-term cost basis holders, ETF cash flows, spot volume, open interest, funding rates, and global liquidity conditions.
Disclaimer: The views expressed belong exclusively to the author and do not reflect the views of this platform. This platform and its affiliates disclaim any responsibility for the accuracy or suitability of the information provided. It is for informational purposes only and not intended as financial or investment advice.

.png)