Bitcoin Liquidation Heatmap: A Complete Guide for Traders
2026-02-19
A Bitcoin liquidation heatmap is a visual tool traders use to map price levels at which leveraged positions are at risk of liquidation.
With high volatility in the crypto market, this heatmap helps identify potential zones for large movements due to forced sell or buy orders.
Traders who understand heatmaps can be better prepared for sudden price spikes and better manage risk.
Key Takeaways
Bitcoin liquidation heatmap shows price levels at which leveraged positions are at risk of being liquidated.
This tool helps traders anticipate volatility zones and potential extreme price movements.
Heatmap data is usually taken from the aggregation of several large exchanges such as Binance and Bybit.
New User Bonus! Get Digital Gold (XAUT) & Silver (SLVON) Rewards
What Is Bitcoin Liquidation Heatmap?
A liquidation heatmap is a visual representation of price levels at which many leveraged positions will be forcibly closed. Liquidation occurs when a trader's margin is insufficient to withstand price movements, prompting the exchange to close the position to prevent further losses.
The heatmap displays the concentration of vulnerable leveraged positions, allowing traders to see where the largest liquidation clusters are located.
For example, if many long positions are using high leverage at the USD 60,000 level, then a price drop to that level could trigger mass liquidations.
Read also : How to Trade Crypto in Indonesia for Beginners: A Complete and Easy Guide
How to Read the Bitcoin Liquidation Heatmap
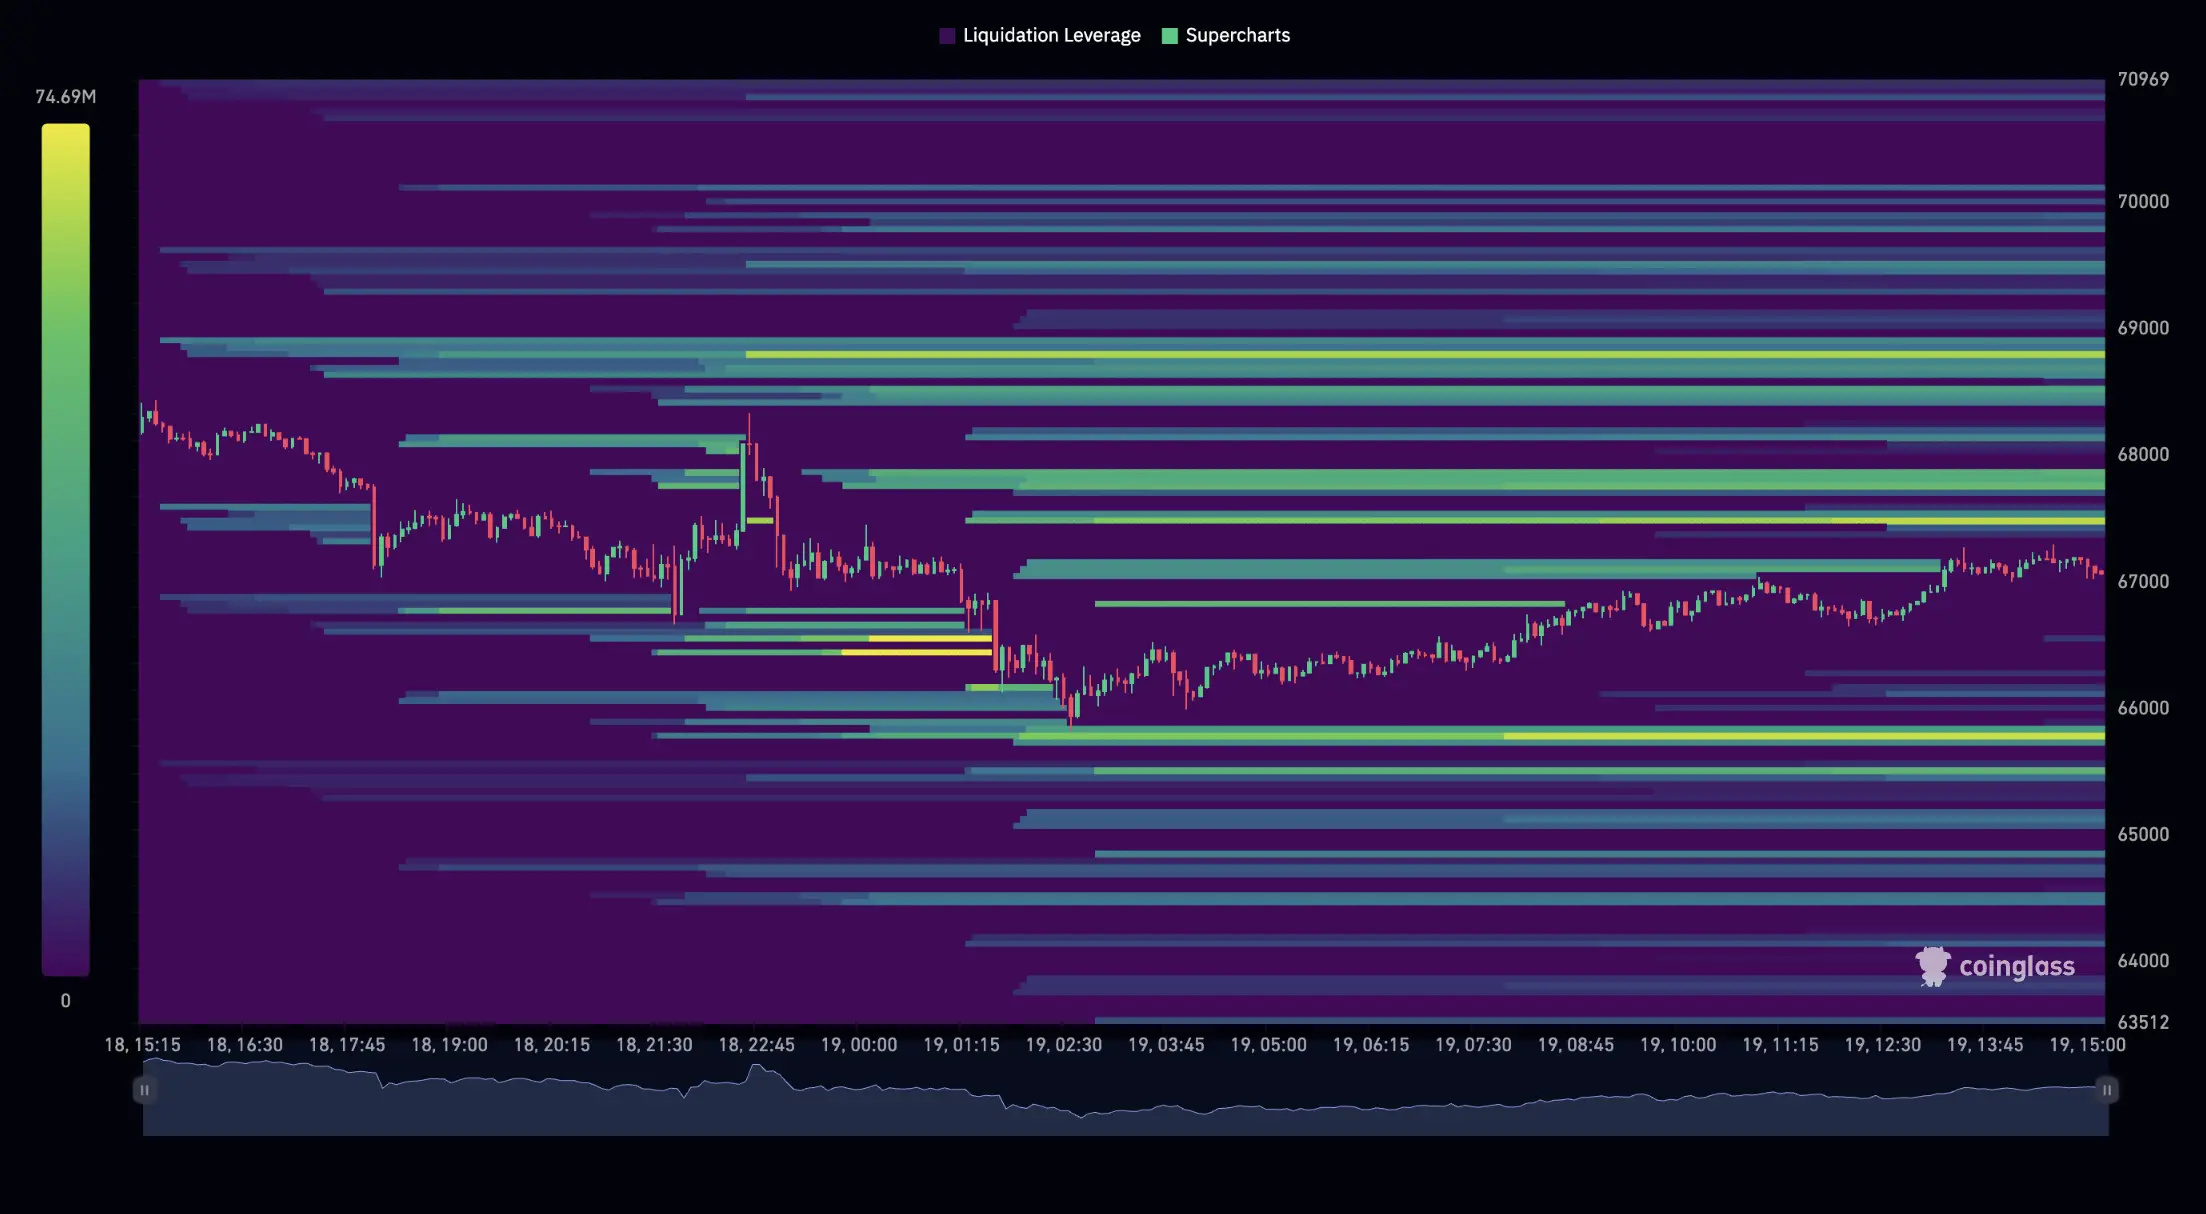
Source: coinglass.com
Red/Orange Zone:Indicates areas with a high concentration of leveraged positions that are at risk of liquidation.
Green/Blue Zone:Areas with lower risk of liquidation.
Level Support dan Resistance:Heatmaps often coincide with important technical levels, so they can provide additional confirmation for traders.
Data Aggregation:Heatmaps typically combine data from multiple exchanges, making them more accurate in showing potential global liquidations.
Manfaat Bitcoin Liquidation Heatmap
Anticipating Volatility:Traders can predict when prices are likely to move sharply.
Strategi Entry/Exit:Determine entry or exit points based on liquidation zones.
Risk Management:Helps avoid high-risk areas that could trigger major losses.
Technical Analysis Confirmation:Used in conjunction with other indicators such as RSI or EMA to strengthen trading decisions.
Read also:How to Read the MACD Indicator in Crypto Trading for Beginners
Risks and Limitations
Non-Real-Time Data:Some heatmaps have a delay so they don't always reflect current market conditions.
Dependence on Exchange:If a major exchange changes margin rules, the heatmap could lose accuracy.
Speculative:Heatmap only shows potential, not certainty of price movement.
Read also:The Complete Guide to Cryptocurrency Trading: What Is Trading?
Conclusion
The Bitcoin liquidation heatmap is an essential tool for derivatives and leverage traders. By mapping liquidation zones, traders can anticipate extreme price movements and better manage risk.
However, heatmaps should be used in conjunction with other technical and fundamental analysis to make more solid trading decisions.
How to Buy Crypto on Bittime?

Want to trade sell buy Bitcoins and crypto investment easily? Bittime is here to help! As an Indonesian crypto exchange officially registered with Bappebti, Bittime ensures every transaction is safe and fast.
Start with registration and identity verification, then make a minimum deposit of IDR 10,000. After that, you can immediately buy your favorite digital assets!
Check the exchange rate BTC to IDR, ETH to IDR, SOL to IDR and other crypto assets to find out today's crypto market trends in real-time on Bittime.
Also, visit the Bittime Blog for interesting updates and educational information about the crypto world. Find reliable articles about Web3, blockchain technology, and digital asset investment tips designed to enrich your crypto knowledge.
FAQ
What is Bitcoin liquidation heatmap?
A visual tool that shows the price level at which a leveraged position is at risk of being liquidated.
How to read a heatmap?
The red zone indicates a high concentration of liquidation, while the green zone is safer.
Why are heatmaps important?
Because it helps traders anticipate volatility and manage risk.
Are heatmaps always accurate?
No, because data can be delayed and depends on the exchange.
Who uses heatmaps?
Derivatives traders, leverage traders, and investors who want to understand market risk zones.
Disclaimer: The views expressed belong exclusively to the author and do not reflect the views of this platform. This platform and its affiliates disclaim any responsibility for the accuracy or suitability of the information provided. It is for informational purposes only and not intended as financial or investment advice.

.png)