BBRI Stocks Today: Price and Latest Developments
2026-08-21
BBRI shares once again became a major focus for investors on August 21, 2026, trading, after previously strengthening 1.95% to Rp3,140.
The latest market data shows BBRI trading at around Rp3,240, up 3.18%, with a trading volume of around 252.91 million shares.
This increase came after foreign investors recorded a net buy of IDR 292.17 billion in trading on August 20, when BBRI closed at IDR 3,140.
Technically, BBRI's main issue now is no longer looking for signs of recovery, but whether the price can break through the resistance area of IDR 3,150 and then open up room towards IDR 3,200-IDR 3,250.
Key Points
BBRI is listed at around Rp3,240 with a 3.18% increase and a volume of around 252.91 million shares in the latest market data.
The Rp3,150 area is a key resistance area. A valid breakout could open the door to Rp3,200-Rp3,250, while a failed breakout would still lead to consolidation as the main scenario.
BBRI's fundamentals remain supportive, with a net profit of around Rp15.5 trillion in the first quarter of 2026, representing a 14% year-on-year growth. However, asset quality and margins still need to be monitored.
BBRI Shares Rise Today, but Rp3,150 Remains a Key Level
BBRI's stock movement on August 21 showed much stronger momentum compared to the previous consolidation phase.
The latest market data from Investing.com shows BBRI at Rp3,240, up 3.18%, with volume of approximately 252.91 million shares. BBRI is also one of the trending stocks listed in the data.
The previous day, BBRI closed at Rp3,140 after strengthening 1.95%.
The increase was accompanied by net purchases by foreign investors amounting to Rp292.17 billion, with a volume of 156.12 million shares and a transaction value of Rp488.44 billion.
The combination of rising prices and foreign capital inflows has provided positive sentiment for BBRI shares.
However, this increase needs to be interpreted in conjunction with resistance, as the price was previously in an area vulnerable to selling pressure.
Read Also:BBCA Stock: Strong Fundamentals, Stable Dividends & Long-Term Prospects
BBRI Stock Price Analysis Trends Positive, but Not Yet Free from Resistance
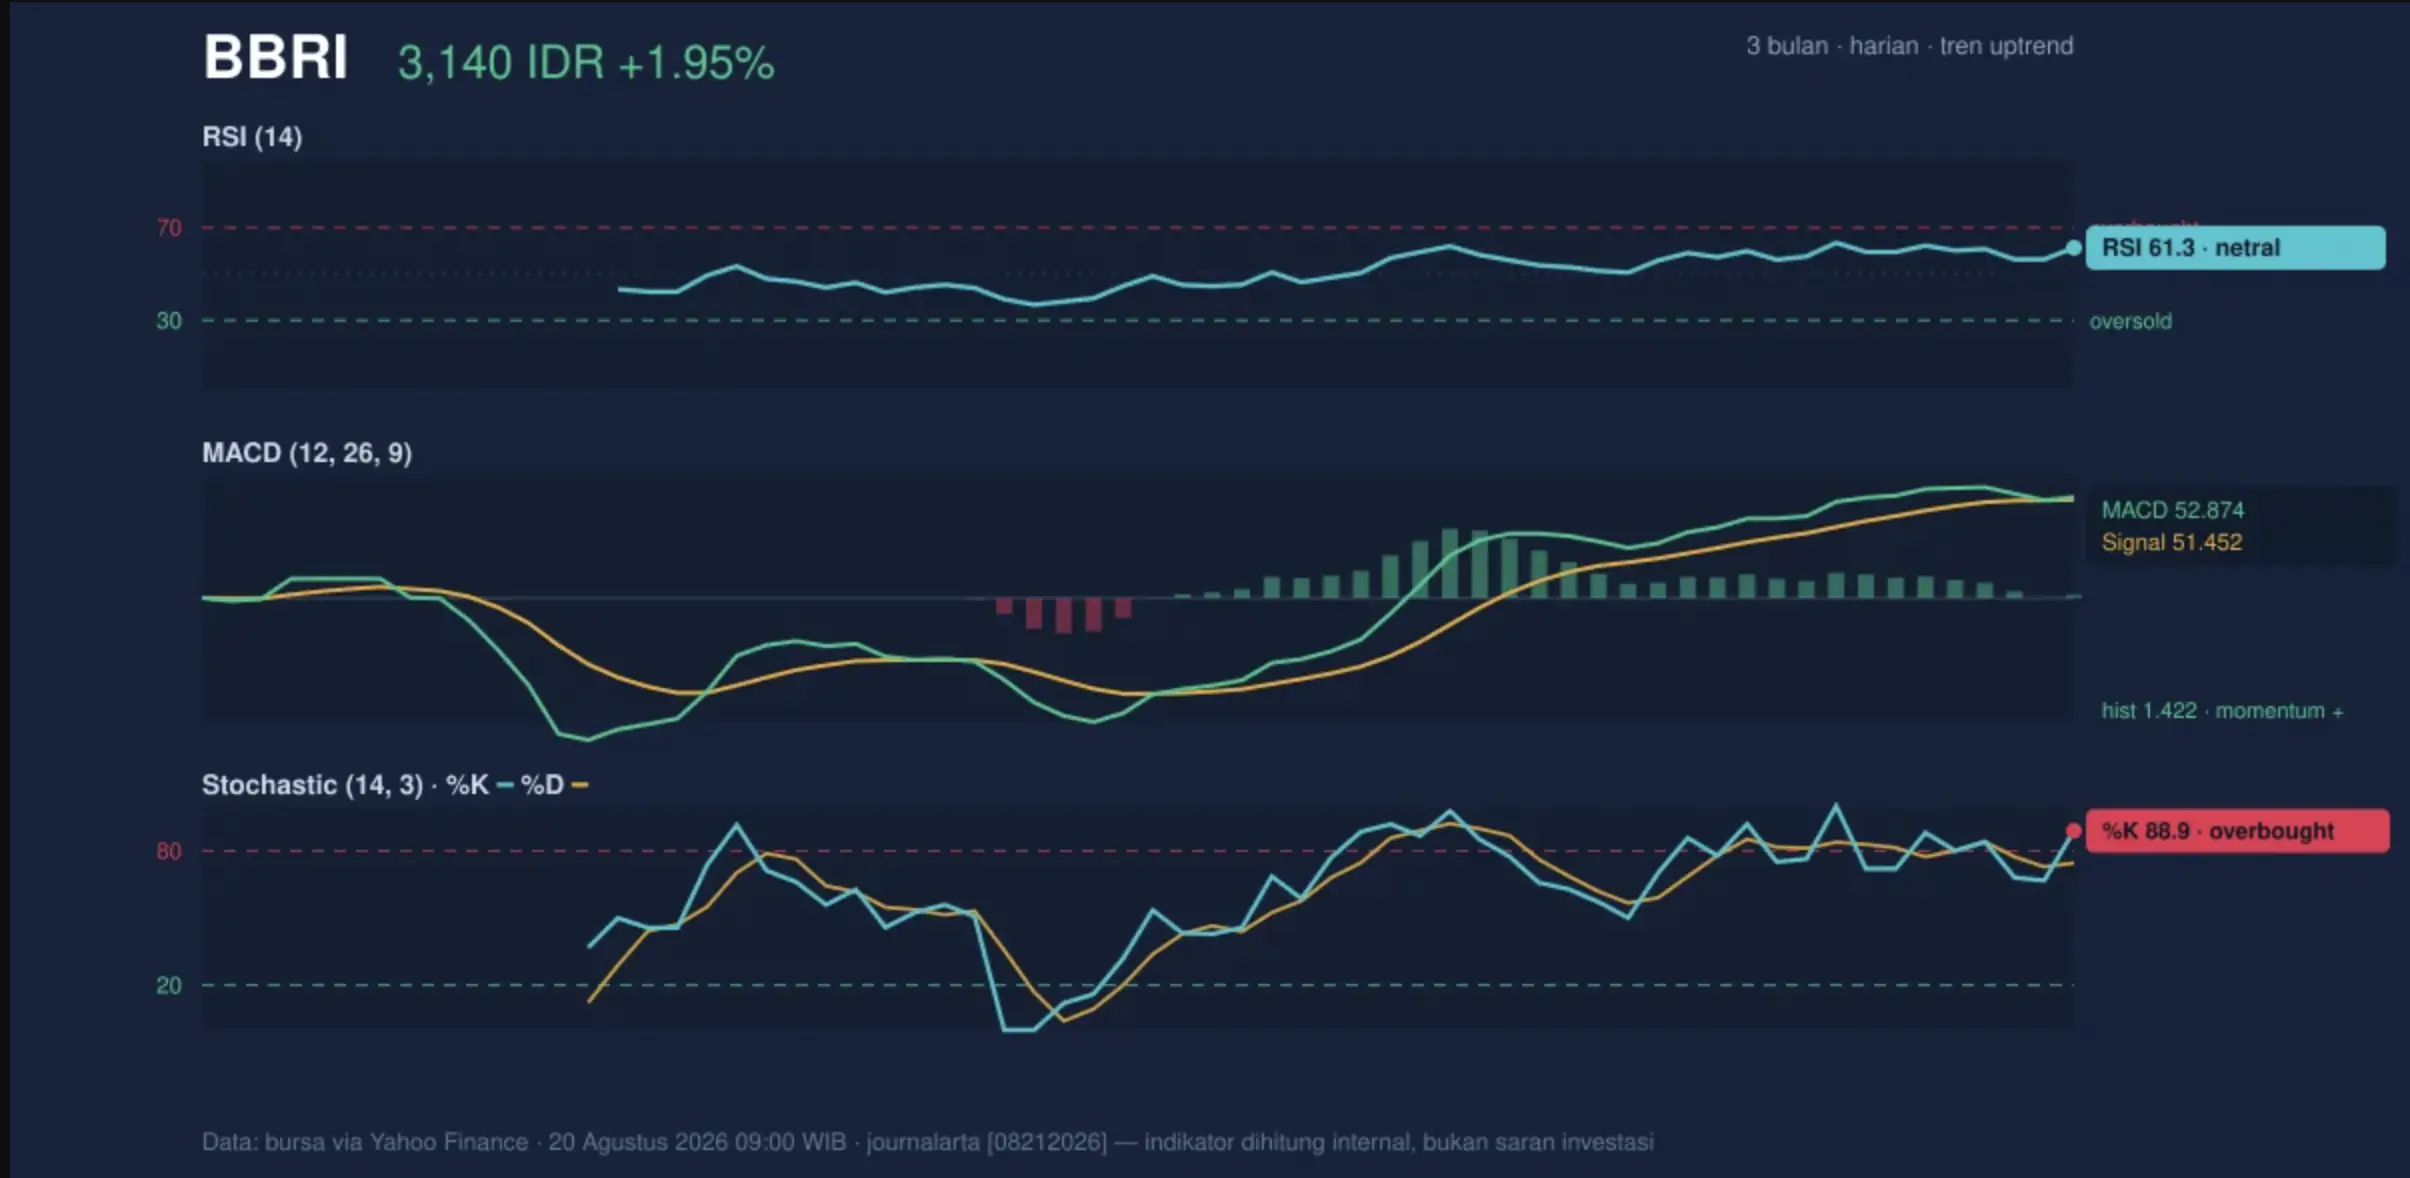
Sumber: journalarta.com
JournalArta noted that on August 20, BBRI was above the SMA20 of Rp3,044.50 and SMA50 of Rp2,936.60.
This position indicates that the short- and medium-term price structure remains in an uptrend. The SMA20 also has a positive slope of around 0.98% over the five days.
However, momentum indicators paint a more balanced picture. The MACD is at 52,874, above the 51,452 signal, with a positive histogram of 1,422. This still supports bullish momentum.
Meanwhile, the Stochastic %K is at 88.9 and %D is at 74.5. This indicates that BBRI has entered short-term overbought territory.
RSI 61.3 is still in the neutral-positive zone so it has not shown the same extreme conditions.
This means that BBRI stock sentiment is indeed improving, but the rapid rise could be followed by a pullback before the next trend is formed.
Read Also:What are Haji Isam's Stocks? Here's the List and Their Risks
A Breakout of Rp3,150 Could Change BBRI's Stock Structure
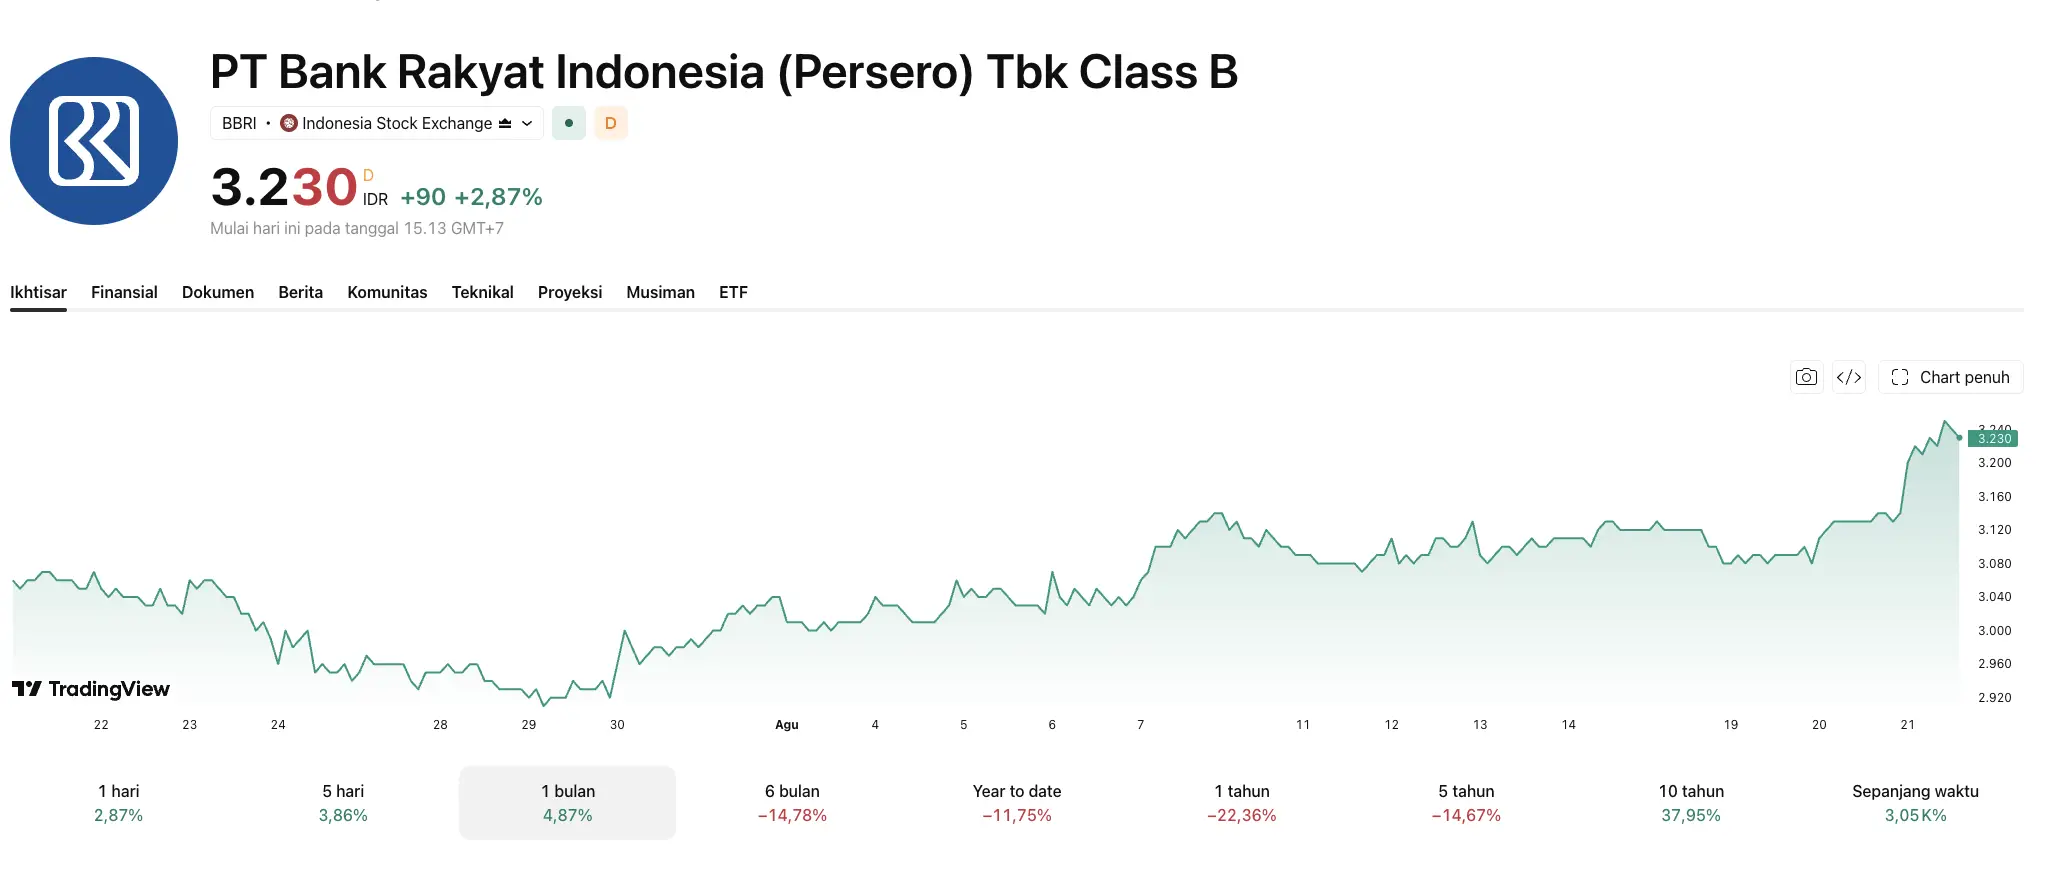
BBRI August 21 | Source: TradingView
The Rp3,150 area is one of the most important figures in BBRI's current stock development. Investing.com analysis places the main resistance at Rp3,100-Rp3,150, with Rp3,200-Rp3,250 as the next target if a breakout is successful.
The bullish scenario will be more convincing if the price is able to break through Rp3,150 with increasing volume and then maintain that area during a retest.
Under such conditions, a rise towards Rp3,200-Rp3,250 makes more sense technically.
On the other hand, simply touching Rp3,150 is not enough to be called a breakout.
If the price falls back below Rp3,120-Rp3,100 after briefly breaking through resistance, there is a risk of a false breakout or bull trap.
For traders, the difference between the two scenarios is quite important.
Chasing the price just below resistance offers a less attractive risk-reward than waiting for confirmation or looking for entry on a pullback.
Read Also:Ripple Adds Korean Bank Partners, Will This Impact XRP Price?
Support at Rp3,010-Rp3,025 is a key level for a bullish scenario.
If BBRI fails to maintain its upward momentum, the Rp3,010-Rp3,025 area will be a zone to watch.
As long as the price remains above this area, the correction can be considered a pullback within a larger recovery structure.
A new problem arises when IDR 3,010 is broken by a strong 4-hour candle accompanied by an increase in volume.
In this scenario, Investing.com analysis estimates that the retracement room could widen towards Rp2,950-Rp2,890.
The Rp2,890 area is also important because it previously served as resistance and has the potential to turn into support.
For longer positions, the Rp2,750-Rp2,850 zone is considered a still relevant demand area.
Thus, BBRI's structure has not automatically turned bearish just because of a correction from IDR 3,150 or IDR 3,200.
Read Also:BUMI Shareholders: Complete List & 2026 Predictions
BBRI's fundamentals remain strong, but asset quality needs to be monitored.
From a fundamental perspective, BBRI still has reason to be concerned. First-quarter 2026 data shows a net profit of around Rp15.5 trillion, a 14% increase compared to the same period last year.
Credit growth also reached around 14%, while the net interest margin was at 7.8%.
However, profit growth hasn't completely eliminated risks. Asset quality, particularly in the micro and MSME segments, remains a key factor to monitor.
Pressures from cost of funds and NIM can also affect BBRI's ability to maintain profitability growth.
Therefore, BBRI's stock development is not solely determined by the price chart. If asset quality improves and margins are maintained, fundamentals could potentially provide the basis for a rerating.
Conversely, if non-performing loan pressures increase, the market may return to more conservative valuations.
Read Also:Buy US Stocks via Crypto, Get 7% Daily Rewards at Bittime
Is BBRI Stock Worth Buying Now?
The answer depends heavily on strategy. For traders, the BBRI setup looks more attractive after the rally towards Rp3,150, but because the price is already approaching resistance, chasing the rally becomes less than ideal.
Confirmation of a breakout above Rp3,150 or a pullback to support with rejection could provide a clearer entry structure.
For investors with a longer horizon, BBRI's fundamentals still provide reason to maintain attention.
BBRI's market capitalization on TradingView is recorded at around IDR 459.40 trillion, with a trailing PER of around 10 times and an indicated dividend yield of 11.05%.
However, these valuation figures should not be interpreted as automatic buy signals. Investors should still consider profit growth, credit quality, net interest margin (NIM), cost of funds, and the bank's ability to maintain profitability.
Given the current conditions, BBRI is more accurately described as being in a bullish-consolidative phase.
A breakout of Rp3,150 would be a key confirmation, while a loss of Rp3,010-Rp3,025 would weaken the short-term bullish thesis.
Want to diversify into digital assets?Register at Bittimeand start monitoring various crypto assets in one platform.
Conclusion
BBRI shares showed more positive momentum today after strengthening 1.95% to Rp3,140 on August 20 and moving higher again in market data on August 21.
Foreign capital inflows of Rp292.17 billion in the previous trading session also strengthened short-term sentiment.
However, the price increase doesn't mean all risks have been eliminated. The Rp3,150 area remains key resistance, while Rp3,010-Rp3,025 is a crucial boundary for maintaining the bullish structure.
If the breakout of Rp3,150 is confirmed by volume, the target of Rp3,200-Rp3,250 will be the next area worth watching.
For investors, the more important question is not simply whether BBRI shares are worth buying, but rather at what price and technical conditions such a purchase would provide a reasonable risk-reward.

Bittime is a licensed and regulated Digital Financial Asset Trader (PAKD) supervised by Indonesia’s Financial Services Authority (OJK) — where you can buy Bitcoin in Indonesia and hundreds of other crypto assets starting from just Rp10,000. The registration process is fast, secure, and you can get started today.
Track USDT to IDR conversions and monitor your favorite crypto assets in real time. Everything is available in one crypto investment app that you can download for free on the Play Store
Ready to start? Register now on Bittime and execute your investment strategy with a platform trusted by millions of users in Indonesia.
FAQ
What is the price of BBRI shares today?
The latest available market data shows BBRI at around Rp3,240, up 3.18%, with a volume of around 252.91 million shares.
Why did BBRI shares rise?
BBRI strengthened after previously rising 1.95% on August 20. On that day, foreign investors recorded a net buy of IDR 292.17 billion in BBRI.
What is the current resistance of BBRI shares?
The Rp3,150 area is a key resistance level. If it is successfully broken through with volume confirmation, the Rp3,200-Rp3,250 area becomes the next target.
What is the support for BBRI shares?
Key support levels are at IDR 3,050 and IDR 3,025-IDR 3,010. If IDR 3,010 is decisively broken, the risk of a correction towards IDR 2,950-IDR 2,890 increases.
Are BBRI shares worth buying?
BBRI still has a relatively positive fundamental outlook and technical structure, but entry should consider confirming a breakout or pullback to minimize the risk of chasing prices near resistance.
Disclaimer: The views expressed belong exclusively to the author and do not reflect the views of this platform. This platform and its affiliates disclaim any responsibility for the accuracy or suitability of the information provided. It is for informational purposes only and not intended as financial or investment advice.

.png)