PREDICT Token Price Prediction 2026: Impact of Futures Listing
2026-10-27
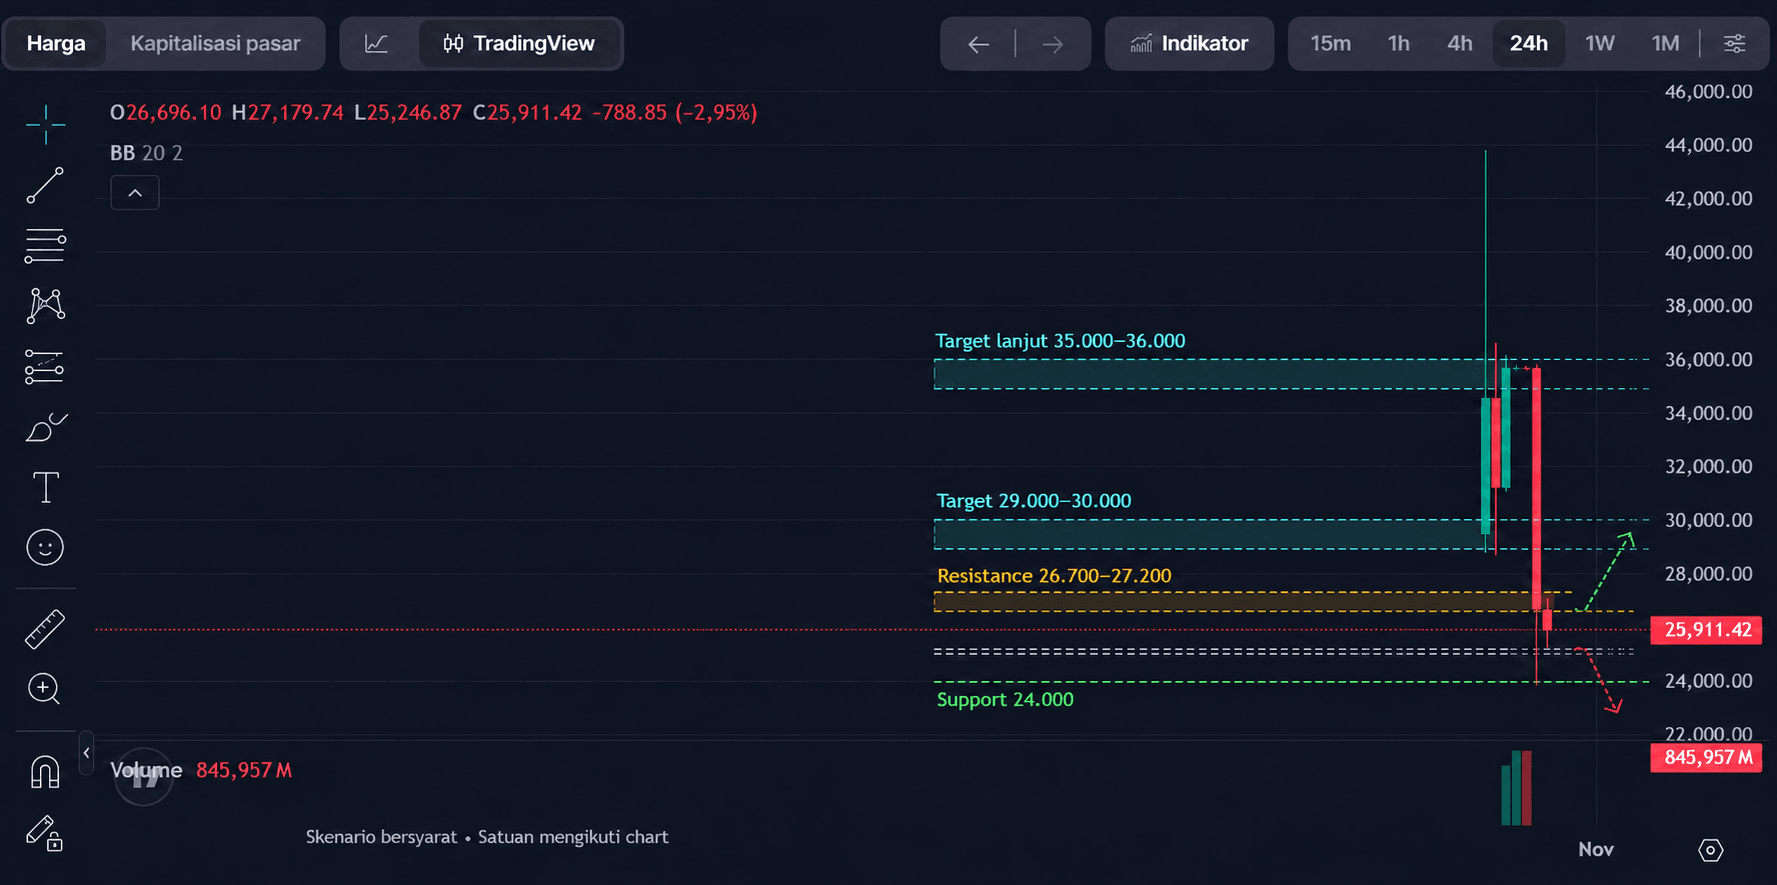
A PREDICT token price prediction for 2026 needs to consider two factors: the potential for increased trading activity following the futures listing and the selling pressure visible on the chart. The image analyzed shows the price falling from around 35,000–36,000 to 25,911.42, so a recovery still requires confirmation.
The launch of the contract gives traders access to both long and short positions. A listing therefore does not automatically increase the token's price. To assess what may come next, we need to understand the type of PREDICT market, the price areas being tested, and the project's development through the end of 2026.
Key Takeaways
- The PREDICTUSDT listing opens pre-market perpetual trading, so its contract price needs to be distinguished from the spot price.
- The chart shows selling pressure, with the areas around 24,000 and 27,200 serving as initial reference points for monitoring price developments.
- Recovery targets are conditional and cannot yet be treated as certain year-end 2026 prices.
What Are PREDICT and Predict.fun?
Predict.fun is a prediction market platform on BNB Chain. Users take positions on the outcomes of events, while PREDICT is the underlying asset for the derivative contract discussed in this article.
These are two different activities. Trading the outcome of an event is not the same as trading expectations about the price of the platform's token.
In a PREDICTUSDT contract, traders make gains or losses from changes in the price of their position. Opening a futures contract is also not the same as buying tokens that can be withdrawn directly to a wallet.
This distinction matters when reading listing information. The product type determines how prices form, which fees apply, and the risks involved.
Read also: DOOD Price Falls After Surging 212%: Is It Still Worth Buying?
PREDICT Price: Distinguish Market Data From Chart Figures
On the price page reviewed for this article, PREDICT was displayed at around US$1.42. The page explicitly stated that its market data came from perpetual trading, with a 24-hour range of US$1.31–US$1.52.
That figure is a snapshot of the page at the time of review, not a price guaranteed to remain valid when the article is read. It also cannot be directly compared with the submitted chart because the chart's units and capture time are not fully specified.
The OHLC information displayed on the chart is:
- Open: 26,696.10.
- High: 27,179.74.
- Low: 25,246.87.
- Close, or the price on the displayed candle: 25,911.42.
- Displayed change: down 2.95%.
The close figure is not necessarily the final daily close if the candle is still forming. Technical confirmation therefore requires waiting for the candle to finish.
All levels in the following prediction section use the chart's units. No conversion to rupiah or dollars is made because the information needed to verify the units is not yet available.
Read also: KIMCHI Coin Price Prediction 2026: Analysis and How to Buy
How Does the Futures Listing Affect PREDICT?
The official announcement records the launch of the PREDICTUSDT pre-market perpetual contract on October 25, 2026, at 08:15 UTC, or 15:15 Western Indonesian Time (WIB). The contract is settled in USDT and offers leverage of up to 5x.
A listing can expand trading access and help the market form price expectations. However, traders can also open short positions, so greater activity does not always mean increased buying pressure.
In the early stages, prices can move sharply when there are too few orders to absorb large trades. Changing expectations about the token launch can also affect the contract's price.
The launch of futures does not guarantee a spot listing. To assess further developments, check announcements that clearly distinguish contract trading, token trading, and deposit and withdrawal services.
Read also: GIGATENEV Pulls Back: Still Appealing, or Is the Hype Fading?
Reading the Price Structure on the Chart
The most prominent feature is a long red candle that took the price down from around 35,000 to around 26,000. Its lower wick reached roughly 24,000, showing that trades briefly occurred well below the previous trading area.
The price then appeared to remain near the bottom of that range. Visually, this indicates selling pressure that has not yet been followed by a strong recovery.
However, only a few candles are available. The identified areas should be treated as provisional reference points, rather than support and resistance levels that have been tested repeatedly.
The BB 20 2 indicator is listed on the screen, but its lines and values are not visible. The analysis therefore makes no claims that the price is below the middle band or touching the lower band.
Price areas to watch
- 25,200–25,300: the low area of the displayed candle, useful as a short-term reference point.
- Around 24,000: the bottom of the wick from the previous decline, based on visual interpretation.
- 26,700–27,200: the initial area that needs to be reclaimed to improve the price's position.
- 29,000–30,000: a previous trading area that could act as a barrier to recovery.
- 35,000–36,000: the area before the sharp decline and a more distant recovery target.
The portion of the axis below 24,000 does not automatically represent support. Scale markings on a chart differ from levels backed by evidence of trades or price reactions.
Read also: FOTF Price Prediction: Can It Break $1? Check the Calculation
PREDICT Token Price Prediction 2026: Three Scenarios
1. Bullish scenario: the price reclaims 27,200
The recovery outlook improves if a daily candle closes above roughly 27,200. The price then needs to hold when it retests that area.
If these conditions are met, 29,000–30,000 becomes the next area worth watching. A recovery toward 35,000–36,000 becomes more relevant only if the earlier barriers are cleared and buying continues.
A brief rise above resistance is not enough to indicate a trend change. The bullish scenario weakens if the price closes back below the newly broken area, especially if it subsequently loses 25,200.
2. Neutral scenario: trading between 24,000 and 27,200
The price could form a range if sellers struggle to push it lower but buyers cannot lift it above 27,200. This range remains a scenario, not a confirmed consolidation pattern.
In this situation, the key development is the formation of several price reactions at the upper and lower boundaries. The clearer those responses become, the more useful the range is for further analysis.
The neutral scenario ends when the price breaks out of the range and stays outside it. The breakout direction then needs to be assessed alongside trading activity.
3. Bearish scenario: the price loses the 24,000 area
Downside risk increases if the price falls through the low area around 25,200 and then breaks below 24,000. A daily close below the previous bottom would weaken the price structure.
The available chart does not show sufficient history below that area. There is therefore no strong basis for setting a precise next downside target.
The bearish scenario weakens if the breakdown fails and the price quickly returns to holding above 24,000. Further recovery still requires a more clearly established price base.
Can These Levels Serve as Year-End 2026 Targets?
Technical levels derived from a few candles are better suited to assessing near-term movements. Using them as year-end targets without additional data would convey excessive certainty.
The outlook through the end of 2026 requires information about circulating token supply, the distribution schedule, trading access, and developments in platform usage. These factors can change the balance of supply and demand after the pre-market stage.
The 29,000–30,000 and 35,000–36,000 areas are therefore conditional recovery targets on the chart. Neither is presented as a price guaranteed to be reached in December.
Read also: Dacity Coin (DACITY) Price Prediction 2026: Analysis and Risks
Tokenomics and Valuation Factors to Watch
The listing specifications state a total and maximum supply of 1 billion PREDICT. This figure does not explain how many tokens are available for trading at any given time.
As a numerical illustration, a price of US$1 with a full supply of 1 billion tokens gives an FDV of US$1 billion. This calculation is not a price target or a market capitalization based on circulating supply.
To assess valuation, readers need to know when tokens enter the market and who receives them. An increase in supply can affect the price if demand does not grow proportionately.
Platform growth also needs to be examined in relation to the token's function. A large number of users does not automatically increase demand for PREDICT if that mechanism has not been explained.
Risks and Next Checks
Before using PREDICT price analysis as a basis for a decision, check three things:
- Market identity. Confirm the symbol, pair, currency, and contract type shown on the chart.
- Trading quality. Check order book depth, fees, funding, and potential differences in execution prices.
- Project confirmation. Monitor official information about token distribution, utility, and changes in trading status.
Leverage makes small price changes have a greater impact on capital. A position can also be liquidated before a longer-term forecast has fully played out.
If you want to explore crypto services, you can sign up for Bittime and learn about the available products. Make sure your trading decisions align with your goals and ability to absorb losses.
Conclusion
A PREDICT token price prediction for 2026 still needs to be conditional. The chart shows selling pressure, while an initial recovery requires a move back above 26,700–27,200 and the ability to hold that area.
The futures listing expands trading access, but price direction remains determined by trading activity and project developments. Use chart levels as reference points for monitoring, then update the analysis once the market identity, currency, and latest candles have been verified.

Bittime is a Digital Financial Asset Trader (PAKD) platform licensed and supervised by Indonesia's Financial Services Authority — where you can buy Bitcoin in Indonesia and hundreds of other crypto assets starting from IDR 10,000. Registration is quick and secure, and you can get started today.
Track the conversion of USDT to IDR and the price movements of your favorite crypto assets in real time. Everything is available in one crypto investment app that you can download for free from the Play Store.
Ready to get started? Sign up for Bittime now and put your investment strategy into action with a platform trusted by millions of users in Indonesia.
FAQ
What is PREDICT token?
PREDICT is an asset associated with Predict.fun, a prediction market platform on BNB Chain. This article discusses its price and derivative contract, not positions on event outcomes on the platform.
What is PREDICT's price today?
The snapshot of the page reviewed showed around US$1.42, using data from the perpetual market. The figure of 25,911.42 on the submitted chart uses unidentified units, so it must not be treated as directly equivalent.
Does the futures listing guarantee that PREDICT will rise?
No. Futures allow both long and short positions, while leverage can amplify volatility in either direction.
What is the difference between PREDICT's pre-market and spot prices?
The pre-market contract price reflects derivatives trading before or during the formation of the token market. The spot price comes from trading the asset itself, so the two can differ.
What is the PREDICT token price prediction for 2026?
On the chart used, a recovery would be more convincing if the price moves above 27,200 and holds, with the next area around 29,000–30,000. A year-end target cannot yet be established reliably from the limited candle history alone.
Disclaimer: The views expressed belong exclusively to the author and do not reflect the views of this platform. This platform and its affiliates disclaim any responsibility for the accuracy or suitability of the information provided. It is for informational purposes only and not intended as financial or investment advice.

.png)