FOTF Price Prediction: Can It Break $1? Check the Count
2026-10-23
A prediction of FOTF reaching $1 requires a numerical assessment. Based on the reference price of US$0.2214, Federal Oil Trust Fund would need to rise by approximately 351.67%, reaching 4.52 times its current value. This calculation illustrates the distance to the target but does not establish the likelihood of reaching it.
The key question is whether demand and market depth can support such an increase. This article examines the required valuation, the ability to resell tokens, and how to evaluate price scenarios without treating the target as a certainty.
Key Takeaways
- The FOTF $1 target requires an increase of approximately 351.67% from the reference price of US$0.2214.
- Assuming a supply of 1 billion tokens, a price of $1 would imply a valuation of US$1 billion.
- Assessing the likelihood of reaching the target requires considering liquidity, the quality of trading activity, and ownership distribution.
What Is Federal Oil Trust Fund, or FOTF?
Federal Oil Trust Fund is the name of the FOTF token, which trades in the FOTF/SOL pair on the Solana network through PumpSwap. The token address discussed in this article is:
H4hcwe8fLmE9g7iwFidhap9LgdBHXM8T5exVRcVupump
Different projects can use the same name, ticker, and token image. Therefore, the contract address is the identifier you should verify before opening a chart or making a transaction.
The words “Federal,” “Oil,” and “Trust Fund” in a project's name are not sufficient proof of any connection to a government, ownership of oil, or entitlement to specific revenue. Such claims require verifiable documentation.
Based on the materials reviewed for this article, that relationship has not been confirmed. The price assessment below does not assume the existence of oil reserves or a government guarantee.
Read also: DOOD Price Falls After a 212% Surge: Is It Still Worth Buying?
FOTF Price: Reference Data and Its Limitations
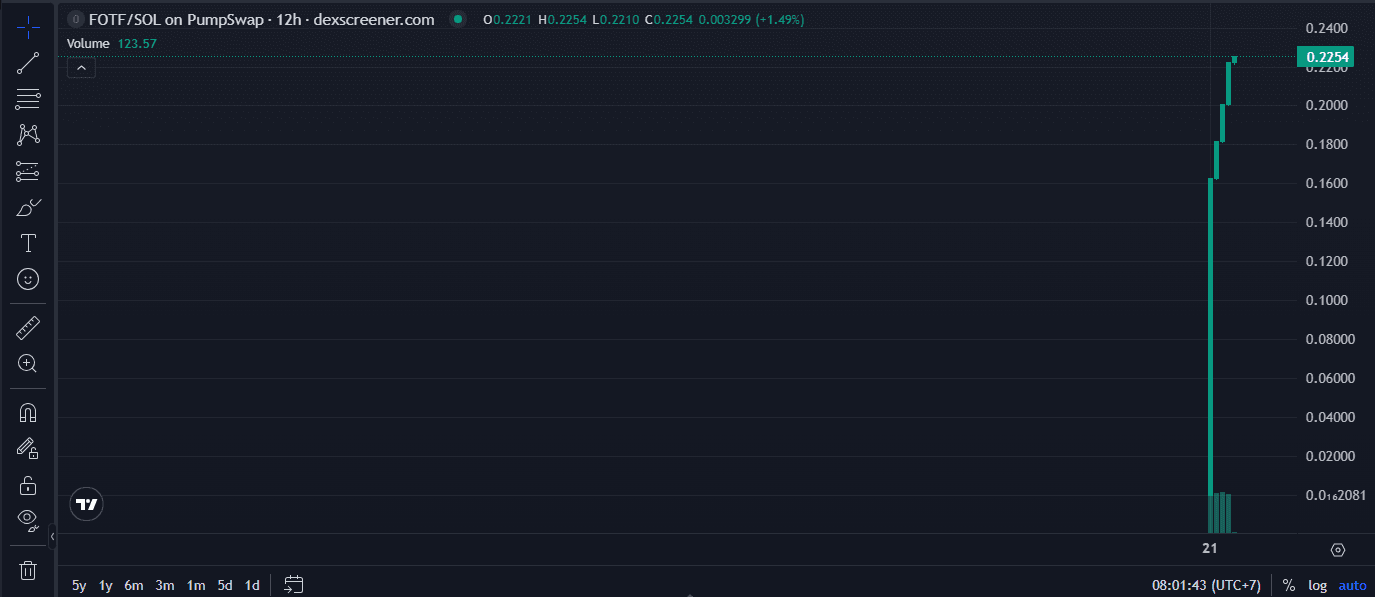
During the review on October 23, 2026, the trading pair page displayed a price of US$0.2214, a market capitalization and FDV of approximately US$221.4 million, and liquidity of around US$1.2 million. These figures are a snapshot of the page at the time of review, not a guarantee of the execution price for a transaction.
This data helps calculate the distance to the target. However, a single snapshot is not enough to conclude that the price is establishing a healthy upward trend.
Sufficient historical candle data could not be verified while preparing this article. Therefore, the analysis does not identify support, resistance, RSI, or breakout signals as though they had already been observed on the chart.
FOTF Price Prediction: How Much Must It Rise to Reach $1?
The formula for calculating the required increase is:
Increase = (target price ÷ reference price − 1) × 100%
Using the reference price above, the calculations are as follows:
- US$0.25: requires an increase of approximately 12.92%.
- US$0.50: requires an increase of approximately 125.84%.
- US$1: requires an increase of approximately 351.67%.
These figures are mathematical calculations, not predictions of timing or probability. The US$0.25 and US$0.50 levels are used as points for mathematical evaluation, not as confirmed resistance levels.
This distinction determines how the target should be interpreted. Saying that a price could reach a certain level is incomplete without explaining the conditions, time horizon, and circumstances that could invalidate the scenario.
Why Are Staged Targets More Useful?
Staged targets help you assess progress without becoming fixated on a single final figure. When the price approaches an evaluation level, check whether market activity is strengthening as well or whether only the latest price has changed.
For example, a price increase accompanied by broader buyer participation provides different information from a rise driven by only a handful of transactions. Both can appear similar when measured by percentage price change.
Read also: KIMCHI Coin Price Prediction 2026: Analysis and How to Buy
If FOTF Reaches $1, What Would Its Valuation Be?
Assume a supply of 1 billion tokens for a simple simulation. At a price of US$0.50, the valuation based on this assumption would be US$500 million; at US$1, it would be US$1 billion.
The formula is:
Implied valuation = token price × number of tokens used in the calculation
This assumed supply must be distinguished from the verified circulating supply. If the relevant token quantity changes, the resulting valuation will also change.
An increase in valuation is not equivalent to the amount of new money entering the market. The latest transaction price can change the calculated value of the entire supply, even if only a portion of the tokens changes hands.
Conversely, a high valuation does not mean all holders can sell simultaneously at the same price. The ability to exit a position depends on market depth at the time of the sale.
Liquidity Test: Can the Token Be Sold at the Displayed Price?
To evaluate whether a purchase is viable, check the estimated proceeds from selling rather than relying solely on the price displayed on the screen. Two positions with the same reference price can produce different execution prices if their transaction sizes differ.
In a pool-based market, transactions change the balance of assets in the pool. The larger a transaction is relative to the pool's depth, the greater its potential impact on the price.
Perform the following checks before making a decision:
- Enter your intended purchase amount to view the estimated number of tokens you would receive.
- Check the fees and price impact shown.
- Compare the estimates for smaller and larger amounts.
- Check the estimated proceeds from a potential sale without executing the transaction.
- Determine whether the difference in proceeds remains within your personal risk limits.
These checks provide a more relevant measure for your position. The liquidity-to-valuation ratio alone cannot replace an execution simulation.
Read also: CATONICE Price Prediction: Can It Reach US$0.1?
Many Transactions Do Not Necessarily Mean Many Buyers
The 24-hour activity snapshot shows 23,595 transactions involving 40 traders. The large difference between these two figures means the transaction count should be considered alongside the number of market participants.
These figures do not prove the use of bots or market manipulation. However, treating every transaction as a new investor would lead to an incorrect conclusion.
The following questions are more useful for assessing demand quality:
- Has the number of traders increased across multiple observation periods?
- Is trading volume distributed across many wallets?
- Are large transactions dominating price movements?
- Are the active wallets connected to one another?
- Does activity persist after the initial attention fades?
Individual transaction analysis is necessary before drawing conclusions about trading patterns. Aggregate data only indicates which areas require further investigation.
Read also: 1WIN Token Price Prediction After Listing: Potential and Risks
Three Scenarios for Evaluating the FOTF $1 Target
1. Strengthening Scenario: Rising Demand and Improved Execution
A positive scenario requires a combination of rising prices, broader market participation, and the ability to absorb sell orders. Improvement should be visible across several periods, rather than in a single transaction.
Under these conditions, the earlier mathematical evaluation points can be used to reassess a position. The final target remains conditional until supported by market evidence.
This scenario weakens if the price continues to rise while liquidity declines or trading activity becomes increasingly concentrated. Such a rise could make positions more difficult to sell.
2. Sideways Scenario: Activity Continues Without a Clear Direction
A price moving back and forth does not yet provide evidence that the distant target is getting closer. In these conditions, transaction costs and decision frequency may influence results more than the price direction itself.
The evaluation approach is to compare market conditions at consistent intervals. Avoid changing your conclusion every time a small price movement occurs.
3. Weakening Scenario: Reduced Ability to Absorb Sell Orders
A negative scenario deserves attention when sell quotes deteriorate, liquidity decreases, or buyer participation declines. These conditions can increase execution losses even when the nominal value of a position appears small.
A price decline alone does not prove that a token has become cheap. Reassessment should consider whether the original reasons for buying are still supported by the data.
Read also: Artificial Inu (AI) Price Prediction: Can It Reach US$1?
Is FOTF Worth Buying to Pursue the $1 Target?
The available data is insufficient to conclude that the $1 target has a high probability of being reached. A defensible conclusion is to quantify the required increase and identify the evidence that still needs to be examined.
Before buying, complete three key checks: token holder distribution, liquidity conditions, and the project's identity and claims. Then determine your risk amount and exit conditions before making a transaction.
If you want to start using Bittime's services, you can register with Bittime and check the assets available in the app. This invitation does not mean that FOTF is currently available for trading on the platform.
Conclusion
An FOTF price prediction targeting $1 should be assessed by examining the required increase, supply assumptions, and the market's ability to absorb transactions. Target calculations help measure the distance, while a buying decision requires further verification.
Use the figures as a basis for evaluation and update your analysis as market conditions change. To explore available assets, you can review market information through Bittime.

Bittime is a licensed Digital Financial Asset Trader (PAKD) platform supervised by the Financial Services Authority (OJK) — where you can buy Bitcoin in Indonesia and hundreds of other crypto assets starting from IDR 10,000. Registration is quick and secure, and you can get started today.
Track the USDT to IDR conversion rate and real-time price movements for your favorite crypto assets. Everything is available in one crypto investment app that you can download for free from the Play Store.
Ready to get started? Register with Bittime now and put your investment strategy into action with a platform trusted by millions of users in Indonesia.
FAQ
Can FOTF Reach $1?
Mathematically, the target can be calculated, but its likelihood cannot yet be determined from the available data. Evidence of sustained demand, liquidity conditions, and verified supply information is required.
How Much Must FOTF Rise to Reach $1?
From the reference price of US$0.2214, the required increase is approximately 351.67%. This calculation changes if the reference price changes.
Is FOTF Backed by Oil Reserves?
Oil reserve backing could not be verified from the materials reviewed for this article. A project's name alone is not sufficient to prove asset ownership or redemption rights.
What Is the FOTF Price Prediction for 2026?
There is insufficient evidence to reliably establish a target for the end of 2026. The evaluation should use conditional scenarios and be updated based on market developments.
Why Can the FOTF Chart Price Differ from the Selling Price?
The chart price reflects recorded transactions, whereas a sell quote takes market conditions and transaction size into account. Fees, price changes, and price impact can affect the final proceeds.
Disclaimer: The views expressed belong exclusively to the author and do not reflect the views of this platform. This platform and its affiliates disclaim any responsibility for the accuracy or suitability of the information provided. It is for informational purposes only and not intended as financial or investment advice.

.png)