DOOD Price Drops After 212% Jump: Is It Still Worth Buying?
2026-10-22
DOOD Price is around Rp42.40 on the chart after briefly reaching the Rp90 area and facing a sharp rejection. This correction raises an important question: does the price now offer a buying opportunity, or will selling pressure continue? Based on the chart structure, a recovery remains conditional on the price holding the Rp40 area and breaking through the nearest resistance.
This move followed a report of a 212% rise in DOOD over 24 hours on October 21, 2026. A surge of this magnitude attracts attention, but it is not enough to prove that the strength is sustainable. Understanding the price position, trading activity, and risks is more important than chasing a rally that has already happened.
Key Takeaways
- The chart price is around Rp42.40 after a strong rejection near Rp90.
- The Rp40–41.44 area is the initial zone to watch, while Rp45–47 is the nearest resistance.
- A buying decision should take price confirmation, liquidity, and loss limits into account.
What Is DOOD Coin?
DOOD is a token associated with NFT project Doodles and is part of the Solana ecosystem. Market data lists a maximum supply of 10 billion tokens, with around 7.8 billion DOOD in circulation at the time of review.
Buying DOOD tokens is different from buying Doodles NFTs. They each have their own markets and demand characteristics, so changes in the token price do not necessarily track the price of the NFT collection.
For prospective buyers, this distinction helps clarify what is actually being evaluated. Brand popularity can attract market attention, but assessing the token also requires examining its utility, supply distribution, and ecosystem activity.
Read also: CATONICE Price Prediction: Can It Break Above US$0.1?
Why Did DOOD Surge 212%?
A report on October 21, 2026, put DOOD's market capitalization at around US$38 million and trading volume at US$213 million when the 212% rise occurred. The same report noted that there had been no new announcement from the team explaining the surge.
Trading volume far exceeding market capitalization indicates very active trading. However, volume counts transactions taking place, including tokens changing hands repeatedly, so it cannot be equated with the amount of new money entering the market.
Without a verified fundamental catalyst, the durability of the rally needs to be tested against subsequent developments. Watch whether the price can establish a new base after the surge or instead returns to its previous trading range.
Why Is DOOD's Price Correcting?
The chart shows a long upper wick on the candle following the major surge. This indicates that the price briefly traded much higher before falling back because demand at those elevated levels could not sustain the rise.
Profit-taking is one possible explanation. However, the chart alone is not enough to confirm selling by whales, position liquidations, or token distribution by specific parties.
A decline from the peak should also be distinguished from the 24-hour price change. A token can fall sharply from its high while still recording a gain relative to the starting point of a different measurement period.
DOOD Price Analysis Based on the Chart
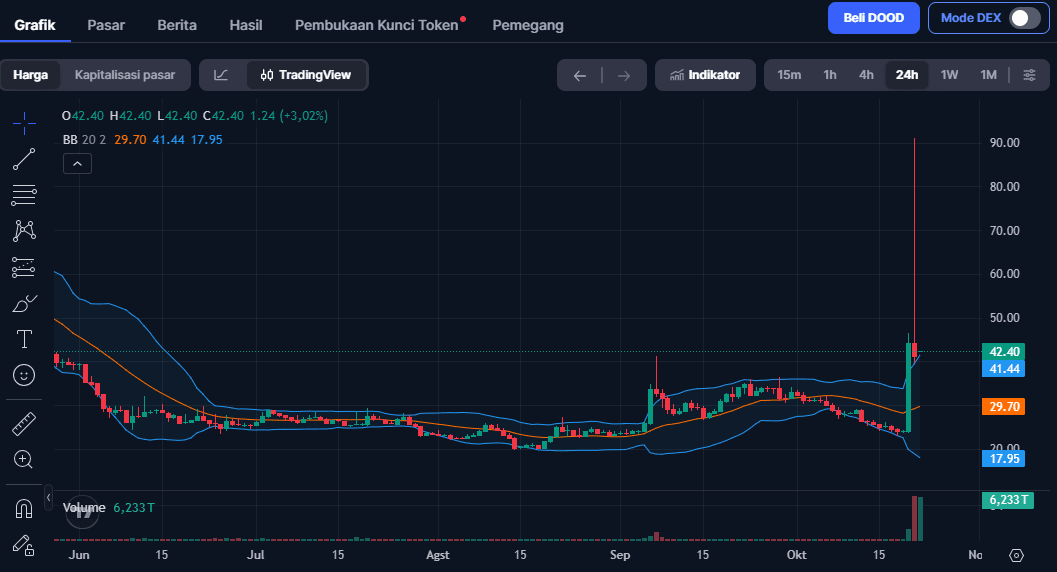
The following analysis uses a screenshot with a 24-hour candle interval and a reference price of around Rp42.40. The screenshot timestamp is not provided, so this figure is a reference for analyzing the image, not a live price quote at the time you read this.
Price Structure: Surge Followed by Rejection
Before the rally, DOOD appeared to trade around Rp23–25. The price then surged into the Rp40 range, with the wick of the next candle reaching approximately Rp90.
This change indicates a major shift in volatility compared with the previous phase. Following the rejection at higher levels, a breakout above Rp45–47 is more relevant to watch first than immediately expecting the price to return to the wick's peak.
One subsequent candle is not enough to confirm the trend direction. More useful confirmation would come from the closing price, the response when a level is retested, and whether the price structure begins to form higher lows.
Bollinger Bands: Trading Range Widens
The Bollinger Bands indicator, set to 20 periods and two standard deviations, shows:
- Upper band: around Rp41,44.
- Middle band: around Rp29,70.
- Lower band: around Rp17,95.
The Rp42.40 price is slightly above the upper band. This indicates a strong move relative to the previous range, but it is not automatically a buy signal or proof that a reversal is imminent.
The widening bands indicate increased volatility. All of these lines are dynamic and can change as new candles form, so they should be distinguished from horizontal support or resistance levels.
Read also: Dacity Coin (DACITY) Price Prediction 2026: Analysis and Risks
Volume: High Activity in Both Directions
Volume bars expanded during the surge and remained high on the correction candle. This means trading activity increased both as the price rose and as it faced rejection.
To assess what may happen next, watch the relationship between volume and price action. A rise on high volume that closes far below its peak reflects a different market response from a rise that holds near its high.
DOOD Support and Resistance Levels to Watch
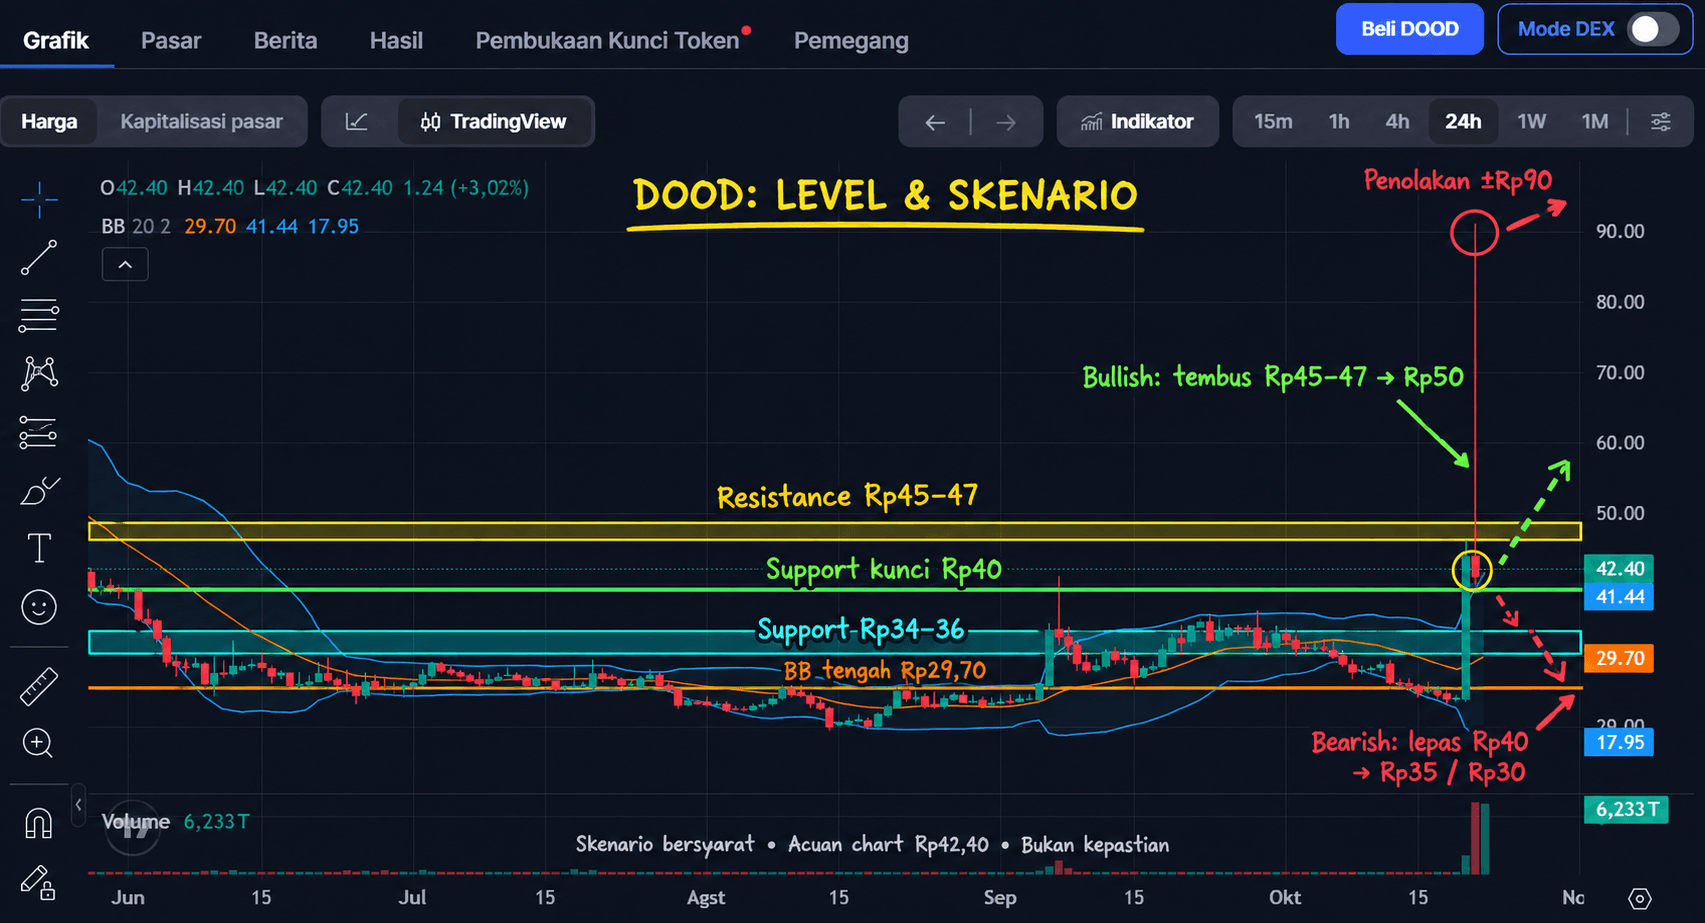
The following levels are estimated zones based on the screenshot, not precise trading points:
- Rp40–41,44: the nearest area to watch, covering the round-number level of Rp40 and the upper Bollinger Band at the time of the screenshot.
- Rp34–36: a historical zone where the price previously traded before declining toward its latest low.
- Rp29,70–30: the middle Bollinger Band combined with a price area that was frequently traded previously.
- Rp23–25: the base before the surge, relevant if the correction deepens.
- Rp45–47: the nearest resistance around the upper end of the initial surge.
- Sekitar Rp90: an extreme rejection area that remains far from the reference price.
The Rp40–41.44 area cannot yet be called strong support simply because the price is above it. That status requires a retest and a visible buying response.
DOOD Price Prediction: Three Scenarios
Bullish Scenario: Holds and Breaks Through the Nearest Resistance
The recovery outlook would strengthen if the price holds the Rp40 area and then closes above Rp45–47. A successful retest that holds the breakout area would provide additional confirmation.
If these conditions develop, Rp50 could become the next psychological reference level. This is not a guaranteed target, and the scenario would weaken if the price quickly falls back below the breakout zone.
Sideways Scenario: Consolidation at Rp40–47
DOOD could move sideways between Rp40 and Rp45–47 while the market seeks a new balance. A range like this would allow the market to absorb trading activity after the major surge.
Declining volume during consolidation does not necessarily mean interest is disappearing. The next direction becomes clearer when the price breaks out of the range and manages to hold that position.
Bearish Scenario: Losing the Rp40 Area
A close below Rp40 followed by a failed attempt to reclaim it would increase the risk of a test of Rp34–36. If that zone also breaks, attention would shift to around Rp29.70–30.
The Rp23–25 area becomes a more distant reference if the structure continues to weaken. This downside scenario becomes less relevant if the price holds above Rp40 again and forms a higher base.
Read also: 1WIN Token Price Prediction After Listing: Potential and Risks
Is DOOD Coin Still Worth Buying?
DOOD may still be considered by readers who understand the risks of high volatility and have a clear trading plan. However, a price that has fallen from its peak does not automatically indicate that it is undervalued.
For short-term trading, the main focus should be the quality of confirmation and the distance to resistance. For longer-term holding, the analysis should include project developments, token utility, and potential changes in circulating supply.
Before making a decision, check these five things:
- Purchase objective: decide whether you are pursuing a short-term move or have a long-term thesis.
- Entry conditions: define the evidence you want to see, such as a resistance breakout or a bounce from support.
- Invalidation point: define the conditions that would show your initial assessment is no longer valid.
- Position size: adjust the purchase amount to the loss you can afford to bear.
- Execution costs: check the spread, transaction fees, and order-book depth.
For example, an entry too close to resistance may offer limited upside compared with the distance to the loss limit. Therefore, evaluating the potential reward relative to the risk is more useful than simply calculating how far the price has fallen.
Read also: Artificial Inu (AI) Price Prediction: Can It Break Above US$1?
Practical Steps Before Buying DOOD
Start by matching the ticker, network, and token identity on the platform you use. This helps prevent confusion with other assets that have similar names.
Next, check the latest price for the correct trading pair. Levels from a chart denominated in rupiah should not be applied directly to dollar or stablecoin pairs without adjustment.
If you want to use Bittime, you can register on Bittime, complete account verification, and then check whether DOOD and its trading pair are available. Proceed with a purchase only if the asset is available and the transaction details match your plan.
Conclusion
DOOD's price presents both opportunities and risks after a 212% surge was followed by a sharp rejection. On the chart, the key factors to watch are whether the price can hold around Rp40 and break above Rp45–47, while losing support would open the possibility of a deeper correction.
A buying decision should be based on confirmation and clearly defined risk limits. Update market data and check the asset's availability on Bittime before executing a trading plan.

Bittime is a licensed Digital Financial Asset Trader (PAKD) supervised by Indonesia's Financial Services Authority (OJK) — where you can buy Bitcoin in Indonesia and hundreds of other crypto assets starting from Rp10,000. Registration is quick and secure, and you can get started today.
Track the conversion rate for USDT to IDR and the prices of your favorite crypto assets in real time. It's all available in one crypto investment app that you can download for free from the Play Store.
Ready to get started? Sign up for Bittime now and execute your investment strategy on a platform trusted by millions of users in Indonesia.
FAQ
Why did DOOD's price fall after rising 212%?
The chart shows a strong rejection after the price reached a much higher level. Profit-taking may have played a role, but identifying the specific cause requires data beyond the chart.
Is now the time to buy DOOD?
A falling price alone is not a sufficient reason to buy. Consider whether the price can hold support, the room to resistance, and the potential loss before deciding when to enter.
Where are DOOD's support and resistance levels?
In the screenshot, the nearest area to watch is around Rp40–41.44, with the next support at Rp34–36. The nearest resistance is estimated at Rp45–47, and all levels should be updated as the market moves.
Could DOOD's price return to Rp90?
That possibility cannot be determined from a single chart. The price first needs to break through the nearest resistance and build a stronger upward structure before a retest of the Rp90 area becomes relevant.
What are the risks of buying DOOD after a major surge?
Risks include a rapid correction, a false breakout, widening spreads, and execution at an unfavorable price. A previous surge also does not guarantee that demand will continue to increase.
Disclaimer: The views expressed belong exclusively to the author and do not reflect the views of this platform. This platform and its affiliates disclaim any responsibility for the accuracy or suitability of the information provided. It is for informational purposes only and not intended as financial or investment advice.

.png)