KIMCHI Coin Price Prediction 2026: Analysis and How to Buy
2026-10-22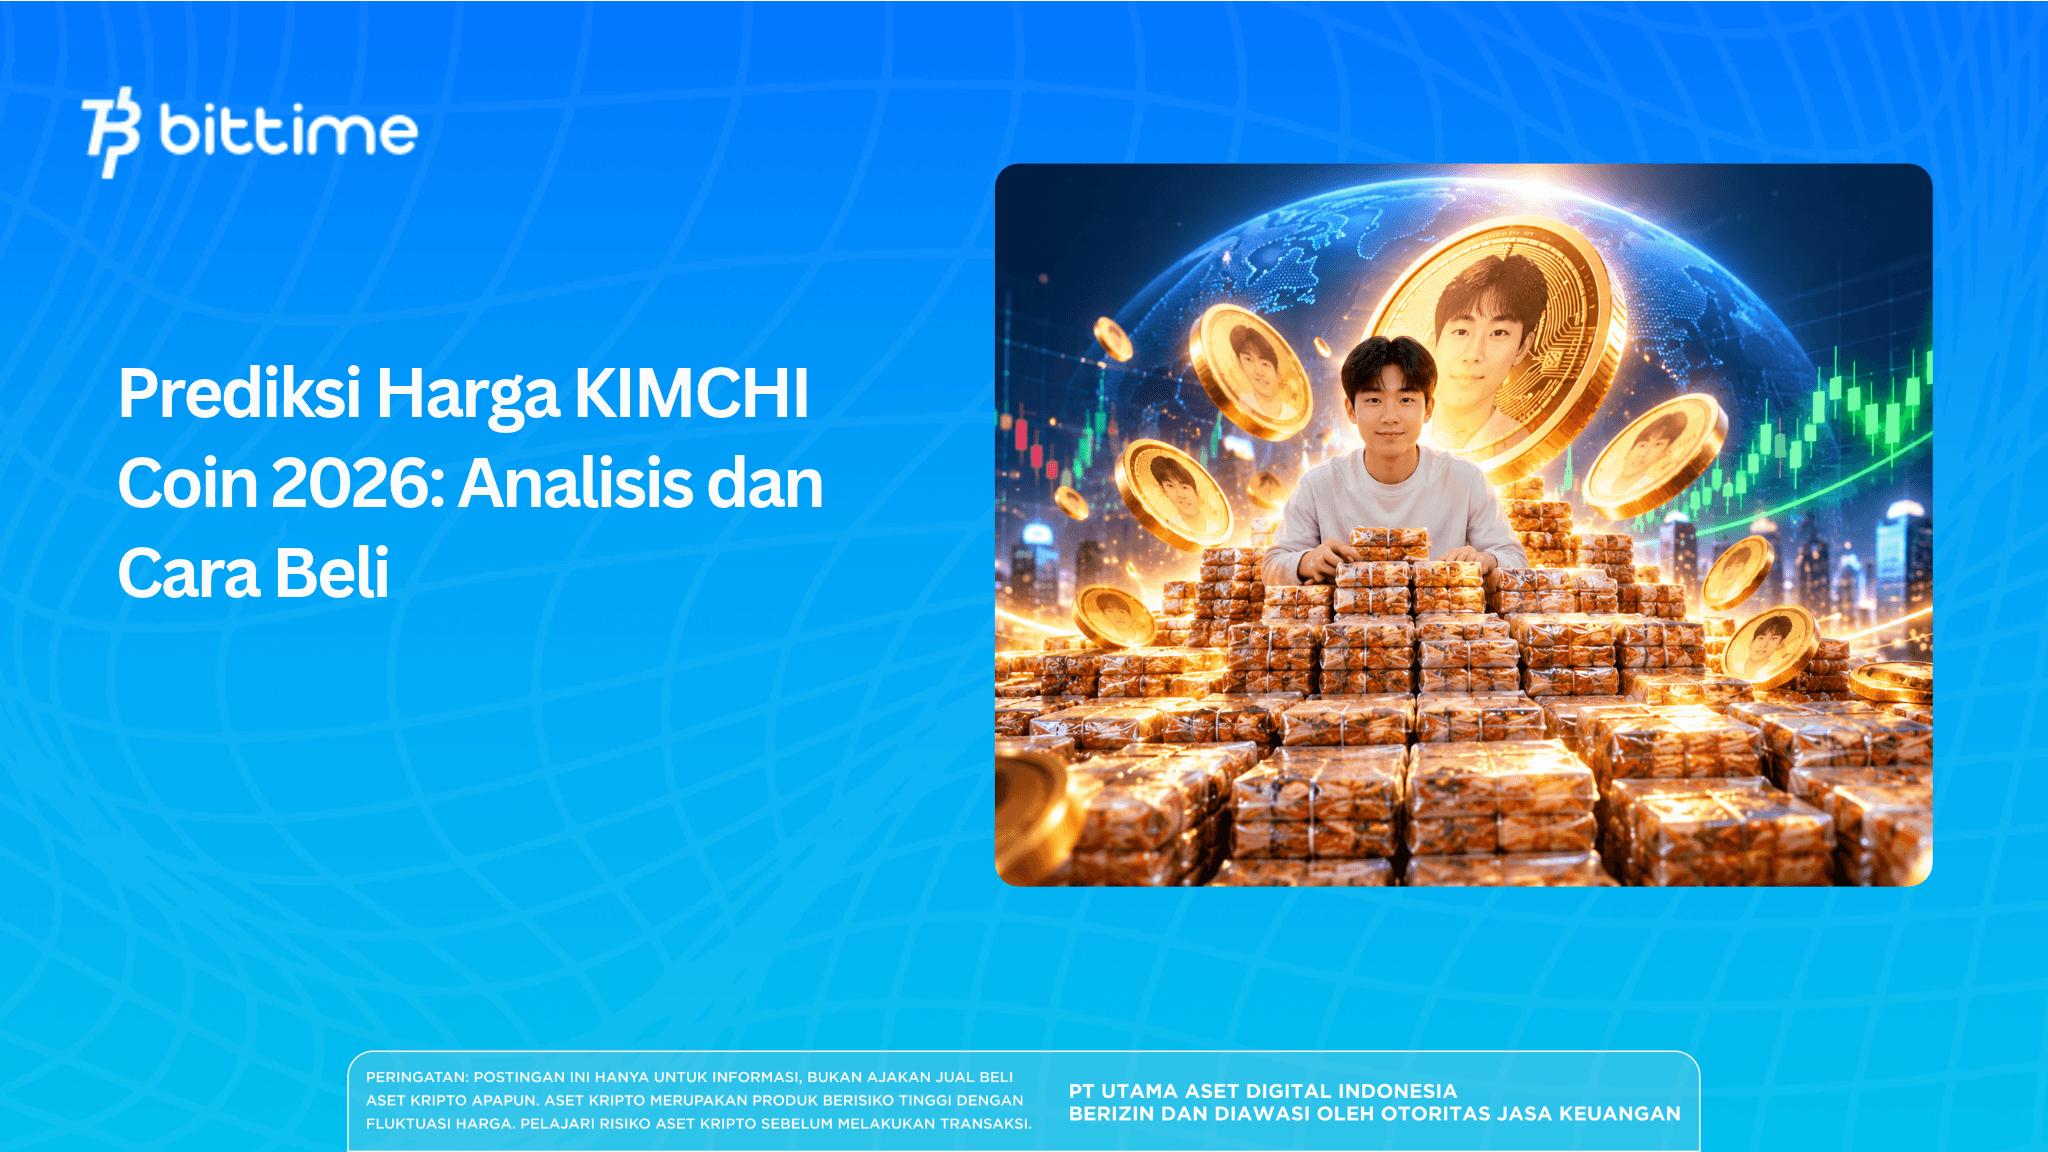
The KIMCHI coin price outlook suggests that a recovery still needs confirmation after an initial surge was followed by a correction. On the 12-hour chart analyzed, the latest price was around US$0.02441, with US$0.023–US$0.025 as the nearest test zone and US$0.030 as a key recovery barrier.
The KIMCHI discussed in this article is Aura Final Boss on the Solana network, not another token with a similar name. The following discussion combines asset identification, technical analysis, price scenarios, and a buying guide to help you assess its condition more clearly.
Key Takeaways
- KIMCHI has corrected after its initial surge, while a trend reversal remains unconfirmed.
- A 12-hour candle close above US$0.030 could strengthen the recovery case.
- Verify the mint address, liquidity, and transaction estimate before buying the token.
What Is KIMCHI Coin?
KIMCHI is the ticker for the Aura Final Boss token on Solana, launched through the pump.fun. The token discussed here has the following mint address:
CSocnzcRpgSCr1naKcNTieWZUxb6rABe45j844m7pump
The mint address identifies the asset, while the pool address identifies a trading pair. When searching for or importing the token into a wallet, use the mint address to avoid confusing it with an asset that has the same name.
The token page lists the creator as a recipient of creator rewards. This does not automatically mean KIMCHI holders receive revenue distributions or have a claim to creator rewards.
Read also: CATONICE Price Prediction: Can It Reach US$0.10?
KIMCHI Coin Price on the 12-Hour Chart
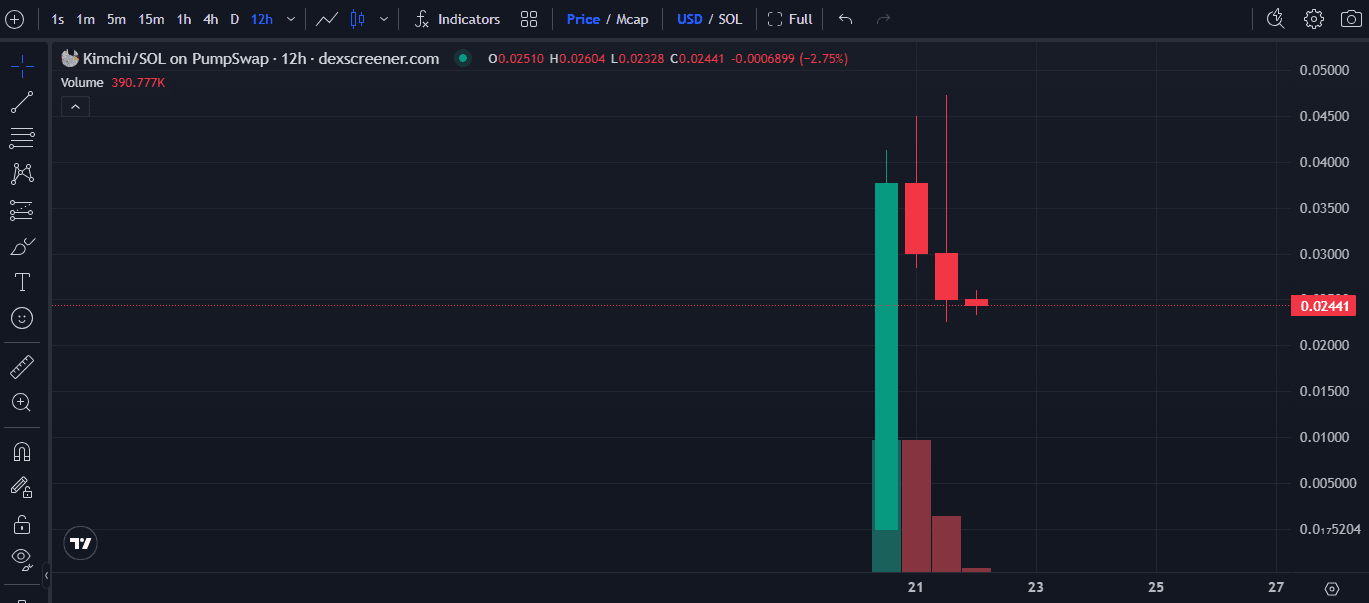
The chart screenshot shows a latest price of US$0.02441. The rightmost candle recorded an opening price of US$0.02510, a high of US$0.02604, and a low of US$0.02328.
The −2.75% figure at the top of the image represents the change in the displayed candle. It should not be described as a 24-hour decline because the chart timeframe is 12 hours.
The screenshot timestamp is not provided, so this data is a reference for chart analysis, not a real-time price. If you are looking up the KIMCHI coin price today, check the latest quote before trading.
KIMCHI Price Analysis: Correction After the Surge
Price Structure Still Shows Selling Pressure
The chart shows a sharp initial rise followed by several red candles. The upper wick reached around US$0.045–US$0.047, but the price failed to hold in that area.
That rejection indicates selling pressure at higher prices. The smaller body of the latest candle may signal a slowdown, but it does not prove that buyers have taken control.
The visible history contains only a small number of candles. Therefore, the following technical levels should be treated as provisional references that still need to be tested.
Nearest Support and Downside Risk Levels
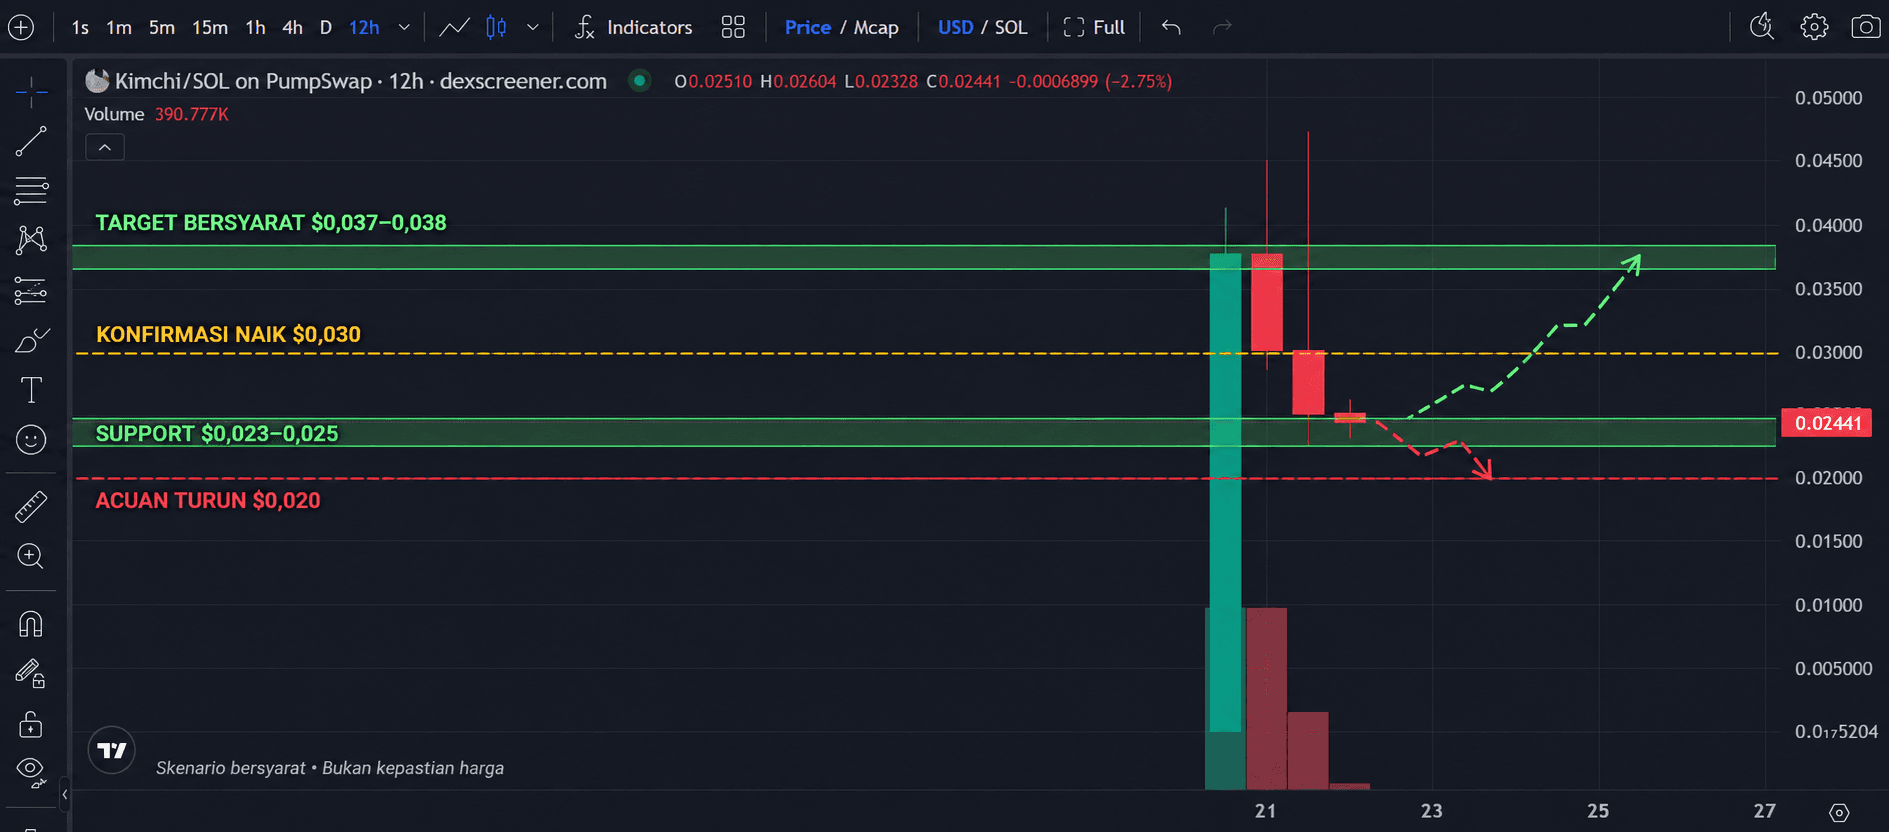
The US$0.023–US$0.025 area is the nearest test zone because it includes the latest price and approaches the low of the most recent candle. Buyer response near its lower boundary can help assess whether the price may hold.
If that area fails to hold, the next level to watch is around US$0.022, near the lower wick of the previous candle. Below that, US$0.020 is a psychological reference rather than a historically tested support level.
Resistance Levels to Break
The initial barrier lies at US$0.026–US$0.030. This range includes the latest candle’s high and the area where previous candle bodies converge.
Above that, US$0.037–US$0.038 is the next test area because it is near the top of the initial candle body. The US$0.045–US$0.047 zone is the upper rejection area visible in the image.
Volume Has Not Yet Confirmed a Recovery
The volume bars are smaller on the latest candle than during the initial period. However, the volume of the rightmost candle may still increase if its formation period has not ended.
Lower volume is not enough to conclude that selling pressure has ended. Recovery confirmation would be stronger if a resistance breakout were accompanied by higher volume on a completed candle.
KIMCHI Coin Price Prediction: Three Scenarios
The following scenarios outline short-term possibilities based on the chart. The available history is insufficient to reliably set a year-end 2026 price target.
Bullish Scenario: Recovery Above US$0.030
The recovery case strengthens if the price holds the nearest zone, breaks above US$0.02604, and then closes a 12-hour candle above US$0.030. Rising volume would help reinforce the signal.
In that case, US$0.037–US$0.038 becomes the next test area. A move toward the upper rejection zone becomes relevant only if the preceding barrier is broken and held.
This scenario weakens if the price loses US$0.023 and fails to reclaim it. A brief resistance break without follow-through is also insufficient confirmation.
Sideways Scenario: Range-Bound Movement
KIMCHI may consolidate within US$0.023–US$0.030 if selling pressure subsides but buyers cannot drive a sustained rise. This range is a scenario, not an established consolidation pattern.
Watch candle closes near both boundaries. A move outside the range that quickly reverses should be distinguished from a sustained breakout.
Bearish Scenario: Price Loses US$0.023
A 12-hour candle close below US$0.023, followed by a failed attempt to reclaim it, could intensify downside pressure. The next areas to watch are US$0.022 and US$0.020.
If the final psychological level also breaks, the chart does not provide enough evidence to set a precise lower target. The bearish scenario weakens if the price holds above the broken area again and forms a higher low.
Read also: Dacity Coin (DACITY) Price Prediction 2026: Analysis and Risks
Other Factors Affecting KIMCHI’s Outlook
Beyond the chart, pay attention to liquidity and holder distribution. Liquidity determines a pool’s ability to absorb trades, while token concentration can magnify the impact of selling by large holders.
Market capitalization is not the same as the funds available to cash out holdings. Therefore, a high valuation does not automatically make large trades easy to execute.
Claims about creator rewards should also be checked separately. If buybacks or community funding are promised, look for evidence of implementation before treating them as price-supporting factors.
How to Buy KIMCHI Coin for Beginners
The identified KIMCHI/SOL pair is on PumpSwap. Recheck the pool status and trading conditions when you are ready to buy.
- Set up a Solana wallet. Keep your recovery phrase private and never enter it on a trading website.
- Keep some SOL available. Leave a balance for network fees, including subsequent transactions.
- Verify the mint address. Check every character, not just the beginning and end.
- Open the correct trading interface. Check the domain and asset pair before connecting your wallet.
- Review the transaction estimate. Check the tokens to be received, fees, price impact, and slippage tolerance.
- Check the transaction after confirmation. Compare the balance change with the record on a blockchain explorer.
Price impact describes how a trade’s size affects the pool price. Slippage is the difference between the expected price and the price at which the trade executes.
Read also: 1WIN Token Price Prediction After Listing: Potential and Risks
Risks and Considerations Before Buying
Key risks include volatility, changing liquidity, holder concentration, and choosing the wrong token. This article has not fully verified holder distribution, so it does not conclude that ownership is broadly distributed.
Set exposure limits and review criteria before trading. Avoid adding to a position simply because the price has fallen without checking for changes in market structure.
If you want to explore a crypto platform, you can sign up for Bittime and review the available assets and services. Mentioning this platform does not mean that KIMCHI is listed there.
Conclusion
The KIMCHI coin price outlook remains in a corrective phase, with any recovery depending on confirmation from price action and volume. Use candle closes, liquidity changes, and verification of the token’s identity as the basis for evaluation before making a decision.
Bittime is a licensed Digital Financial Asset Trader (PAKD) platform supervised by the Financial Services Authority (OJK) — where you can buy Bitcoin in Indonesia and hundreds of other crypto assets starting from IDR 10,000. Registration is quick and secure, and you can get started today.
Track the conversion of USDT to IDR and the prices of your favorite crypto assets in real time. Everything is available in one crypto investment app that can be downloaded for free from the Play Store.
Ready to get started? Sign up for Bittime now and put your investment strategy into action on a platform trusted by millions of users in Indonesia.
FAQ
What is KIMCHI coin on Solana?
The KIMCHI discussed here is the Aura Final Boss token. Its identity is determined by the mint address in this article, not merely by a matching name or ticker.
Can the price of KIMCHI coin rise?
A recovery is possible if support holds and the price breaks resistance with volume support. These are conditions for the scenario, not a guarantee of a rise.
What is the KIMCHI coin price prediction for the end of 2026?
The available chart is not sufficient to set a year-end target. This analysis uses short-term scenarios that should be updated as more price history becomes available.
Where can you buy KIMCHI coin?
The identified pair is KIMCHI/SOL on PumpSwap. Make sure the pool is still active and the token address matches before trading.
Does a price decline mean KIMCHI is cheap now?
A price decline does not automatically mean the valuation is attractive. You still need to assess liquidity, selling pressure, holder distribution, and the sustainability of demand.
Disclaimer: The views expressed belong exclusively to the author and do not reflect the views of this platform. This platform and its affiliates disclaim any responsibility for the accuracy or suitability of the information provided. It is for informational purposes only and not intended as financial or investment advice.

.png)