FUNToken Price Prediction 2025–2030
2025-12-10
Bittime - FUNToken's price is moving in a relatively calm phase after previously recording a significant spike.
Many market participants are starting to look for long-term FUNToken predictions as the latest four-hour chart shows an interesting pattern that could signal the beginning of a new trend.
By observing the price structure on the current chart, there are several clues worth paying attention to before projecting movements until 2030.
FUNToken Price Trend Based on Today's Chart
The four-hour chart shows an aggressive upward pattern in late November, followed by a sharp decline and sideways movement since early December.
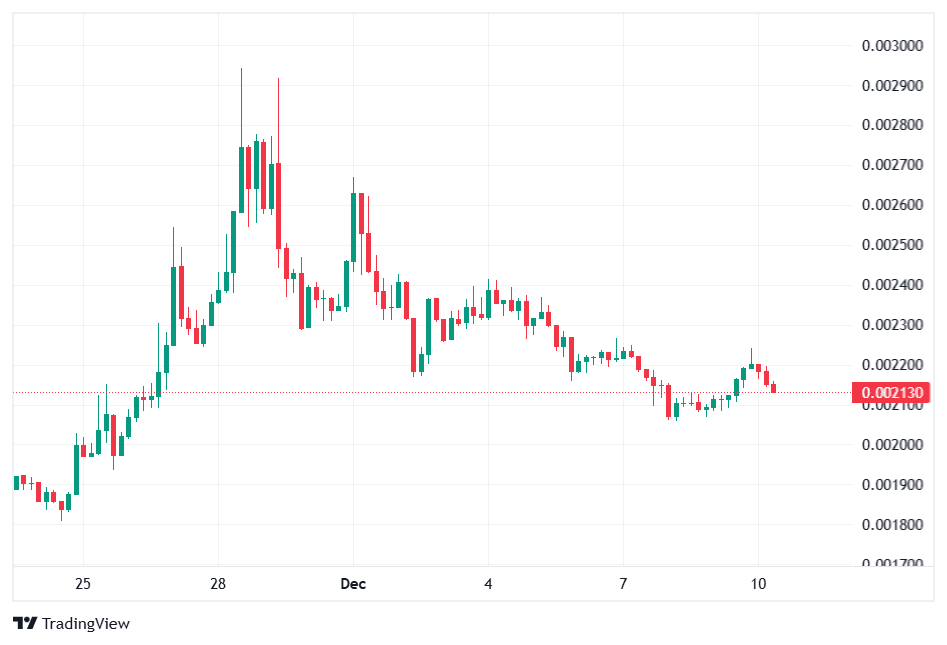
The initial rise formed a higher high structure before a fairly deep correction occurred, indicating that FUN volatility tends to increase when volume enters.
The current price range is around 0.00212, which appears to be a battleground between buyers and sellers. Strong temporary support is seen at the 0.00200 zone, an area that has resisted selling pressure on several occasions.
Meanwhile, short-term resistance is around 0.00235–0.00240, which is the area where the candlesticks have repeatedly held in the last few sessions.
Momentum on the chart shows a consolidation pattern that tends to build new foundations after a retracement.
If this pattern holds, FUN is likely to make a new attempt at a rise in the medium term, especially if volume increases from its current flat position.
Analysis of Support, Resistance, and Next Direction Zones
The 0.00200 support zone is a key determinant. As long as the four-hour candlestick remains above that level, the technical bias remains neutral to bullish. This level previously held back declines and pushed the price back above 0.00218, indicating that market participants view this area as a buying point.
The nearest resistance is at 0.00230–0.00240. If FUN manages to break through and close a four-hour candle above this zone, a higher high structure could potentially re-form. From there, short-term targets would be 0.00255 and 0.00280—two levels that previously served as minor tops.
Conversely, if the 0.00200 support level breaks, the 0.00190 area becomes the next test point. This level served as a baseline before the previous major rally, making it a likely place for buyers to re-enter if a decline occurs.
Structurally, the current chart reflects a token gathering steam after a correction, with the potential for significant movement once the accumulation is complete.

FUNToken Price Projection 2025–2030 Based on Chart Structure
Referring solely to the price patterns, rhythms and character seen on the current chart, here is the long-term scenario:
Moderate Scenario
If this sideways pattern is part of a larger accumulation phase, FUN could form a gradual uptrend throughout 2025–2027. Assuming high volatility persists as in the previous pattern, reasonable long-term targets are in the range of:
• 2025: 0,0030–0,0045
• 2026: 0,0045–0,0060
• 2027: 0,0060–0,0080
• 2028–2030: 0,0080–0,0120
Optimistic Scenario
If a strong breakout occurs and an impulsive pattern like the one seen in late November repeats, the price could move faster than moderate expectations. Under these conditions, FUN has the potential to:
• 2025: 0,0050–0,0070
• 2026: 0,0080–0,0120
• 2027–2028: 0,0150–0,0200
• 2029–2030: 0,0250–0,0400
Conservative Scenario
If sideways movement extends without volume, price growth may be slow. The targets are:
• 2025–2026: 0,0025–0,0035
• 2027–2028: 0,0035–0,0050
• 2029–2030: 0,0050–0,0065
The above projections are not influenced by fundamental factors or news, but purely reflect the structure seen on the chart you provided.
Technical Factors to Monitor Going Forward
- Breakout from the 0.00230–0.00240 zone
This will confirm the potential for a medium-term reversal.
- Retest support 0,00200
If this area continues to hold, accumulation is likely to become stronger.
- Trading volume
Your chart shows low volume after a decline. Increasing volume usually signals the beginning of a major move.
- Repetitive impulsive patterns
FUN has demonstrated the ability to make short but powerful surges. Historical patterns like this can provide clues to the token's future behavior.
Conclusion
Based on the chart you uploaded, FUNToken is currently in a fairly healthy consolidation phase after a decline from its local peak.
Support at 0.00200 is a key point that determines the direction in the next few days or weeks. If the price is able to move above 0.00230–0.00240, the opportunity to form a new uptrend is opening up.
In the long term, historical movements and current price patterns provide room for moderate to optimistic growth in the 2025–2030 range, with the greatest potential coming from breakout moments and increased volume.
FAQ
What is the strongest technical signal on the FUN chart today?
Consolidation above the 0.00200 support level indicates that buyers are still maintaining the price structure, although momentum has not yet strengthened.
Is FUN in a bullish or bearish phase?
Currently FUN is in a neutral phase with a tendency to form a new bottom after a correction.
Is there a chance of a breakout in the near future?
The opportunity will increase if the price breaks through the resistance of 0.00230–0.00240 with a strong candle on the four-hour timeframe.
How important is the 0.00200 area?
This area is a key defensive point. If it is breached, the trend could weaken again in the short term.
Can the price of FUNToken increase significantly before 2030?
There is a possibility, especially if the previous impulsive pattern reappears and the price gradually breaks through several major resistances.
How to Buy Crypto on Bittime

Want to trade sell buy Bitcoins and crypto investment easily? Bittime is here to help! As an Indonesian crypto exchange officially registered with Bappebti, Bittime ensures every transaction is safe and fast.
Start with registration and identity verification, then make a minimum deposit of IDR 10,000. After that, you can immediately buy your favorite digital assets!
Check the exchange rate BTC to IDR, ETH to IDR, SOL to IDR and other crypto assets to find out today's crypto market trends in real-time on Bittime.
Also, visit the Bittime Blog for interesting updates and educational information about the crypto world. Find reliable articles about Web3, blockchain technology, and digital asset investment tips designed to enrich your crypto knowledge.
Disclaimer: The views expressed belong exclusively to the author and do not reflect the views of this platform. This platform and its affiliates disclaim any responsibility for the accuracy or suitability of the information provided. It is for informational purposes only and not intended as financial or investment advice.

.png)