Understanding the USDT Dominance Chart - Its Role and Impact
2026-04-27
Bittime - USDT Dominance charts are an analytical tool that is often overlooked by novice traders, even though they play a crucial role in understanding market sentiment.
Simply put, what is USDT dominance? It is the ratio between the market capitalization of USDT and its market capitalization.Tether (USDT) to the total market capitalization of all cryptocurrencies.
This figure shows how much of the market “pie” is controlled by the world’s largest stablecoins.
Understanding the movement of this indicator can be the key to reading the next market direction.
Key Takeaways
USDT dominance (USDT.D) is the ratio of Tether's market capitalization to the total crypto market — rising indicates risk-off (bearish) sentiment, falling indicates risk-on (bullish).
The relationship between USDT.D and Bitcoin prices is inverse. When USDT.D rises, investors seek refuge in stablecoins; when it falls, they are ready to deploy ammunition to buy assets.
Monitor USDT.D on TradingView (symbol: USDT.D). Peak dominance often signals a market bottom, while declining dominance confirms an uptrend.
Register at Bittime now and start trading crypto with a fast, safe, and easy process in the app.

What Is USDT Dominance?
USDT dominance can be described as a barometer of sentiment. When this indicator rises, it indicates that investors prefer holding USDT over other cryptocurrencies like Bitcoin or Ethereum.
This usually happens when the market is uncertain (bearish).
Conversely, when USDT dominance decreases, it means investors are starting to feel confident enough to leave the “safe zone” and enter other crypto assets, signaling a bullish market.
TradingView's USDT dominance chart provides a tool to monitor these movements in real-time, showing a clear inverse relationship between USDT dominance and the total crypto market capitalization as a whole.
Read Also:How to Buy and Transfer USDT
How to Read USDT.D?
It has an inverse relationship with the price movements of most cryptocurrencies. Here's a simple guide to understanding USDT dominance:
USDT.D Naik: Indicates a "risk-off" sentiment. Investors are selling volatile assets (BTC, ETH, altcoins) and securing funds in USDT. This often occurs during market corrections or when entering a crypto winter.
USDT.D Down: Indicates a "risk-on" sentiment. Investors are confident in the market's prospects. They are moving their USDT to exchanges to buy Bitcoin and altcoins, driving the market up.
In other words, USDT.D and Bitcoin prices generally move in opposite directions.
Read Also:USDT Dominance Is Key to Stablecoin Stability, Here Are the Facts
USDT's Crucial Role in the Ecosystem
Over time, USDT dominance has become key to stability. USDT isn't just a place to park funds; it's the primary liquidity engine for crypto. Some important facts:
Market share: USDT's dominance in the stablecoin market has jumped from 55% to 75% in the past two years, taking over three-quarters of the market.
Giant Supply: USDT supply has reached $118 billion, making it a major bridge between the fiat and crypto worlds.
Record on the Stock ExchangeUSDT balances on crypto exchanges reached a record high of $20.3 billion. This is "ammunition" ready to be deployed to purchase assets.
Tether as a company is also very healthy. They generated approximately $400 million in revenue in 30 days and posted a net profit of over $4.5 billion in the first quarter of 2024, largely from investments in Bitcoin and gold.
The Impact of USDT Dominance on Trading Strategies
Understanding these metrics provides strategic advantages:
How to Monitor the USDT Dominance Chart
TradingView's USDT dominance chart is a great tool for monitoring this indicator. On the TradingView platform, the symbol for this chart is USDT.D.
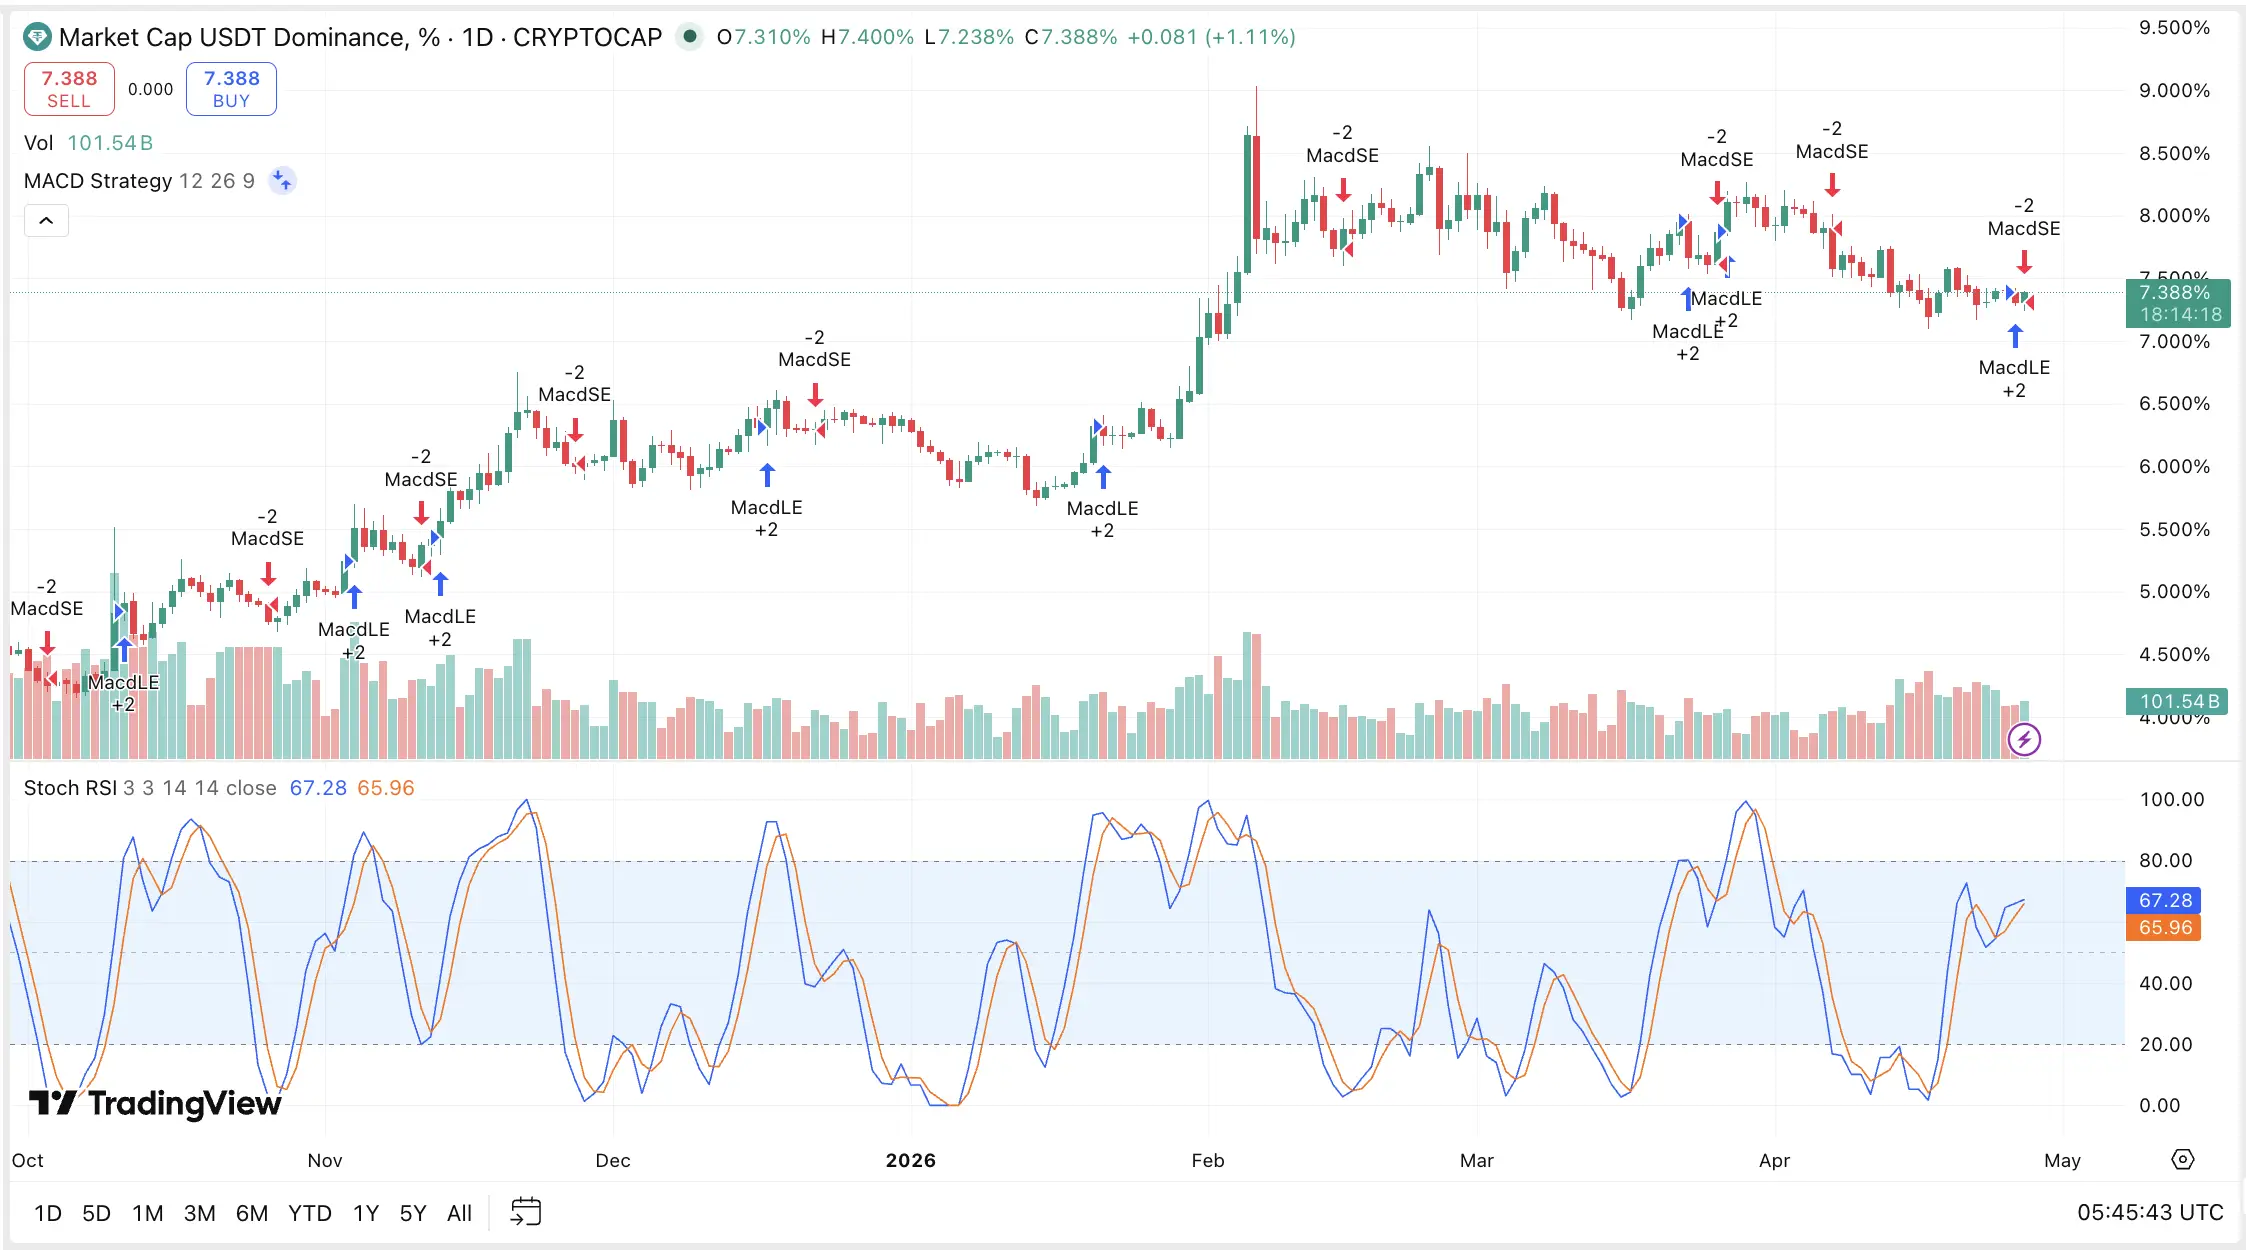
Source: TradingView
Here, you can see real-time values, historical data, and technical indicators such as Moving Averages, RSI, and MACD applied directly to the dominance chart.
Based on the latest data, USDT.D is moving in the range of 7.30%, which means that of the total crypto market value, approximately 7.30% is USDT.
This number is volatile and is an interesting level to watch.
Read Also:Convert 1 USDT to IDR
Simple Application Example
Imagine, over the past few weeks, the crypto market has been bearish. Bitcoin's price has dropped from $80,000 to $70,000.
At the same time, you see the USDT dominance chart continuing to climb. This confirms that investors are panicking and taking refuge in USDT.
Then, when Bitcoin price starts to stabilize at $70,000 and USDT.D stops rising (plateaus or starts falling), it could be a signal that selling pressure has eased.
When USDT.D starts to fall sharply, it is a strong signal that the "ammunition" is being deployed and a bull market is about to begin.
Conclusion
The USDT dominance chart is a must-have tool in your analytical toolkit. It provides an extra layer of confirmation beyond traditional technical and fundamental analysis. By understanding its movements, you can...
You can gauge market sentiment more accurately, predict potential trend reversals, and manage entry and exit strategies more wisely.
It is a sentiment compass that, if read correctly, can help you move with the market's mainstream, not against it.
How to Buy Crypto on Bittime?

Want to trade sell buy Bitcoins and crypto investment easily? Bittime is here to help! As an Indonesian crypto exchange officially registered with OJK, Bittime ensures every transaction is safe and fast.
Start with registration and identity verification, then make a minimum deposit of IDR 10,000. After that, you can immediately buy your favorite digital assets!
Check the exchange rate BTC to IDR, ETH to IDR, SOL to IDR and other crypto assets to find out today's crypto market trends in real-time on Bittime.
Also, visit the Bittime Blog for interesting updates and educational information about the crypto world. Find reliable articles about Web3, blockchain technology, and digital asset investment tips designed to enrich your crypto knowledge.
FAQ
What does USDT dominance chart stand for?
This is a chart showing the ratio of Tether's (USDT) market capitalization to the total market capitalization of all cryptocurrencies, usually symbolized as USDT.D on platforms like TradingView.
What is the relationship between USDT dominance and Bitcoin price?
Generally, the relationship is inverse. When USDT.D rises, Bitcoin prices tend to fall, and vice versa. This is because a rise in USDT.D signals investors are "risk-off" and exiting volatile assets.
Can USDT dominance be used for long-term predictions?
It's more effective for measuring short- and medium-term sentiment. For long-term predictions, this indicator should be combined with other fundamental and on-chain analysis.
Is USDT the most dominant stablecoin?
Yes. USDT's market share has reached approximately 75% of the entire stablecoin market, making it the absolute market leader.
Where can I see a live USDT dominance chart?
You can view it for free on websites like TradingView by searching for the symbol USDT.D. Platforms like CoinGecko and CoinMarketCap also provide related data.
Disclaimer: The views expressed belong exclusively to the author and do not reflect the views of this platform. This platform and its affiliates disclaim any responsibility for the accuracy or suitability of the information provided. It is for informational purposes only and not intended as financial or investment advice.

.png)