XRP Price: Technical Analysis and Sentiment of Ripple Coin Movement
2026-08-21
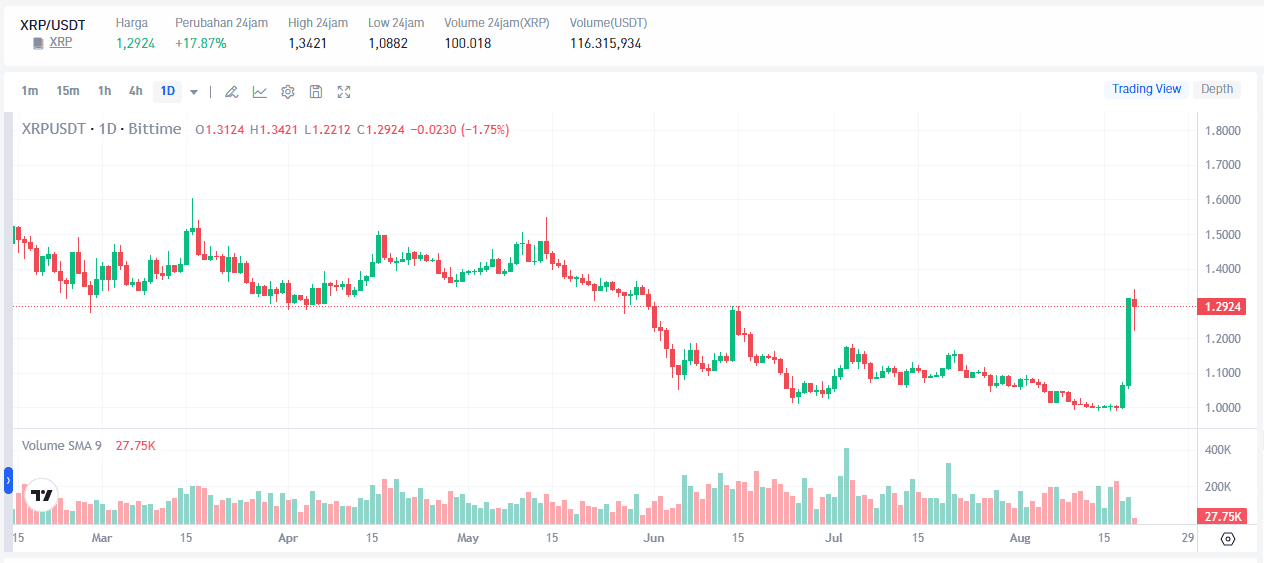
XRP price has just surged about 15–18% in a short period and managed to break back above the psychological $1.00 level, trading in the $1.10–1.15 range.
This sharp move has fueled hopes of a broader trend breakout, but analysts remain divided on whether this rally is sustainable or just a price trap before another decline.
Key Takeaways
- XRP price surged sharply and managed to break back above the key $1.00 level, driven by improving regulatory sentiment and global liquidity policies.
- Technical indicators show improving momentum but still face dense resistance levels above the current price.
- Analyst sentiment is divided: some project further gains to $1.30–1.60, while others warn of the risk of falling back below $1.00.
Price Movement and Breakout Above $1.00
XRP price managed to rise and break back above the $1.00 level after several weeks of sideways movement below it. The roughly 15–18% rally in a short period brought the price into the $1.10–1.15 range, while also touching its highest level in two months.
The breakout above $1.00 is seen as a significant signal because that level has functioned as both support and strong resistance for a considerable period.
This rise was driven by several factors: the announcement of the U.S. government's bond buyback policy, which loosened global liquidity; progress in crypto asset regulatory frameworks that reduced cross‑border uncertainty; and the successful issuance of $275 million in debt securities, which boosted financial institutions' confidence in Ripple technology.
In addition, trading volume concentrated during the London and New York market overlap surged sharply, indicating growing interest from institutional players.
However, it is important to note that consistent daily closes above $1.00 are still needed to validate the strength of this breakout. If price falls back and closes below $1.00, the newly formed uptrend structure could instantly fail and return XRP to its previous trading range.
Also read: Ripple Adds Korean Bank Partner: What's the Impact on XRP Price?
In‑Depth Technical Analysis of XRP
The current technical picture for XRP shows a mix of signals that require caution. On one hand, buyer momentum appears to be strengthening; on the other hand, the stacked resistance levels above are still dense and heavy.
Momentum Indicators: The Relative Strength Index (RSI) has risen to around 60, indicating that buying momentum is still ongoing but has not yet entered excessively overbought territory.
The MACD line is approaching a bullish crossover, which is an early signal of a trend change. Meanwhile, on‑balance volume is rising along with price, indicating accumulation by better‑informed parties.
Moving Averages: The short‑term moving average is already below the current price and could act as a buffer during temporary pullbacks. However, the medium‑ and long‑term moving averages are still well above price, meaning the long‑term trend has not fully turned upward.
The current price also remains below the 200‑day moving average, which acts as a key resistance around $1.28.
Support and Resistance Levels: Below the current price, there is a dense support zone at $1.08, $1.05, and $1.01, with $0.99 as the nearest floor.
On the upside, resistance levels are stacked tightly starting from $1.12, $1.16, $1.19, up to $1.28, which coincides with the long‑term moving average. These closely packed resistances mean that each small advance will immediately face selling pressure.
Price Pattern: Price is currently forming a double‑bottom pattern that is bullish, but it has not yet been fully confirmed. If price manages to break through the overhead resistances in succession, the pattern will be validated and open the door for further upside.
Conversely, if price stalls at any of those resistances and reverses lower, the pattern risks becoming a price trap.
Also read: XRP Price Prediction August 2026: Holding at $1 or Rebounding?
Market Sentiment and Analyst Views
Market sentiment is split into two contrasting views, both with strong foundations:
Bullish View: Some analysts argue that the breakout above $1.00 signals the end of the repeated decline pattern and opens the path toward $1.30 as the next resistance.
If it manages to break $1.30 with adequate volume support, the next target sits in the $1.55–1.60 range, implying a potential upside of about 30% from current levels.
There are even much more ambitious long‑term projections toward $5–9, though those targets require price structure confirmations that have not yet formed.
Bearish Warning: Other analysts warn that this rally risks being a price trap.
Also read: XRP Adds New Cross‑Chain Path: What's the Impact on the Ecosystem?
They point to the fact that long‑term moving averages are still well above price, the wave structure has not fully turned, and resistance levels are stacked very tightly overhead. If price fails to hold above $1.00 and closes below it, the scenario of a decline back to $0.85–0.95 becomes a real possibility.
Sentiment Conclusion: At this point, neither side has a definitive victory. The rally has indeed occurred and is supported by improving short‑term indicators, but the still‑stacked overhead resistance and imperfect long‑term structure demand high caution.
Daily closes above or below key levels will be the most reliable determinant of the next direction.
To monitor XRP price movements in real time and get the latest news affecting the crypto market, you can also register on Bittime and monitor market updates regularly. Use analysis as research material, not the sole basis for investment decisions.
Conclusion
XRP price managed to rise and break back above the key $1.00 level, driven by improving regulatory sentiment and rising institutional interest. Technical analysis shows improving short‑term momentum, but price still faces dense resistance in the $1.12–1.28 range and has not yet broken above the long‑term moving average.
Analyst sentiment is divided between a continuation toward $1.30–1.60 or a decline back if it fails to hold above $1.00. The key is to watch daily closes: holding above $1.00 strengthens the case for further upside, while a close below returns XRP to its previous consolidation range.

Bittime is a Digital Financial Asset Trader (PAKD) platform licensed and supervised by the Financial Services Authority — where you can buy Bitcoin in Indonesia and hundreds of other crypto assets starting from Rp10,000. The registration process is fast, secure, and can be started today.
Monitor USDT to IDR conversions and the price movements of your favourite crypto assets in real time. All available in one crypto investment app that can be downloaded for free on the Play Store.
Ready to start? Register now on Bittime and execute your investment strategy with a platform trusted by millions of users in Indonesia.
FAQ
Why did XRP price surge sharply?
The rise was triggered by a combination of factors: loosening global liquidity policies, progress in crypto asset regulatory frameworks, and the successful debt issuance that boosted financial institutions' confidence in Ripple.
Has XRP already broken into a valid uptrend?
Not fully confirmed yet. The breakout above $1.00 is a good first step, but price still needs to break through the stacked resistances at $1.12–1.28 and the long‑term moving average for the uptrend to be considered valid.
Where is XRP price headed next?
If it breaks $1.12 and holds, the path toward $1.30–1.60 opens up. If it stalls and drops back below $1.00, the risk of a decline to $0.85–0.95 re‑emerges.
Where are the key support and resistance levels?
Key supports at $1.08, $1.05, $1.01, and $0.99. Consecutive resistances at $1.12, $1.16, $1.19, and $1.28, which coincides with the long‑term moving average.
What will determine XRP's next direction?
Daily price closes above $1.00 and the ability to break through the $1.12–1.28 resistance zone. Failure to hold above $1.00 means the current breakout risks being a price trap.
Disclaimer: The views expressed belong exclusively to the author and do not reflect the views of this platform. This platform and its affiliates disclaim any responsibility for the accuracy or suitability of the information provided. It is for informational purposes only and not intended as financial or investment advice.

.png)