Artificial Inu (AI) Price Prediction: Can It Reach US$1?
2026-10-14
Artificial Inu price predictions have attracted attention after AI tokens showed a fairly sharp price increase in recent market data. However, can Artificial Inu reach US$1? At a price of around US$0.11, that target would require a gain of more than 800%, while the 12-hour chart you provided still shows a downtrend from the previous peak.
To assess Artificial Inu AI’s outlook, two factors need to be considered: the possibility of a technical recovery and the valuation required to reach US$1. Supply calculations indicate that this target would imply a market capitalization of around US$991 million if the circulating supply remained close to 991 million tokens. This is still a hypothetical scenario, not evidence that market demand could support that valuation.
Key Takeaways
- Artificial Inu would need to rise by approximately 811.6% from the reference price of US$0.1097 to reach US$1.
- The 12-hour chart shows a downtrend that is beginning to attempt a recovery, but confirmation of a trend reversal is still needed.
- Liquidity risk, volatility, and selling pressure should be considered before evaluating an aggressive price target.
Artificial Inu Price and Current Market Conditions
Artificial Inu (AI) is a crypto token listed on the Robinhood Chain network and traded through several pairs on decentralized exchanges. The AI ticker is also used by other assets, so checking the contract address is important to avoid confusing price, supply, and market capitalization data.
Based on the CoinGecko and DEX Screener pages checked on October 14, 2026, at approximately 2:16 p.m. Western Indonesia Time (WIB), AI was priced at around US$0.11. CoinGecko showed a market capitalization of approximately US$109.04 million, aggregate 24-hour trading volume of around US$18.88 million, a circulating supply of approximately 991.07 million AI, and a maximum supply of 1 billion AI.
These figures are a snapshot from the time of checking and do not guarantee that the same prices will still apply when this article is read. CoinGecko’s aggregate volume also covers a different scope from the volume of a single trading pool on DEX Screener, so the two should not be treated as the same metric.
The asset details used in this analysis are:
- Name: Artificial Inu.
- Ticker: AI.
- Network: Robinhood Chain.
- Chart pair provided: AI/WETH on Uniswap.
- Token contract address: 0x2e8c31162b855a2ffa90f6f8634643ad6f111e18.
- The pool address in the DEX Screener link differs from the token contract address.
The reference price used in the following calculations is US$0.1097, based on the figure shown on the chart and the trading-pair page that was checked. All target-price estimates therefore use one clearly defined reference point, rather than assuming that this price will remain unchanged over time.
Read also: ALTAI Price Prediction: Can Altai the Tiger Break Through US$0.10?
What Would Artificial Inu’s Market Cap Be at US$1?
Artificial Inu’s US$1 target should be evaluated in terms of valuation, not just the price difference per token. A token with a low unit price is not necessarily more likely to rise, because the number of tokens in circulation also determines its market capitalization.
Calculating Artificial Inu’s Required Price Increase
Using the reference price of US$0.1097, the calculation for reaching US$1 is:
- Reference price: US$0.1097.
- Target price: US$1.
- Required multiplier: US$1 ÷ US$0.1097, or approximately 9.12 times.
- Percentage increase: approximately 811.6%.
This means AI’s price would need to rise more than ninefold from that reference point. This calculation only shows the mathematical distance to the target, not the probability that such an increase will occur.
Market Capitalization at US$1
According to CoinGecko supply data, Artificial Inu has approximately 991.07 million tokens in circulation and a maximum supply of 1 billion tokens. If the price reached US$1 while the circulating supply remained unchanged, its implied market capitalization would be around US$991.07 million.
Meanwhile, the fully diluted valuation (FDV), based on the maximum supply of 1 billion tokens, would reach US$1 billion at the same price. The difference between the two figures comes from the supply basis used in each calculation.
An increase in market capitalization from around US$109 million to approximately US$991 million would represent a substantial rise in market valuation. However, this does not mean that net inflows equal to the difference in market capitalization must enter the token, because prices are formed by marginal transactions in the market.
Market capitalization also does not indicate how much money all holders could receive if they sold their tokens simultaneously. Actual sale proceeds depend on liquidity depth, buying demand, and the impact of transactions on price.
Read also: DAWS Price Prediction: Can It Break Through US$0.10?
Artificial Inu Technical Analysis: Support and Resistance
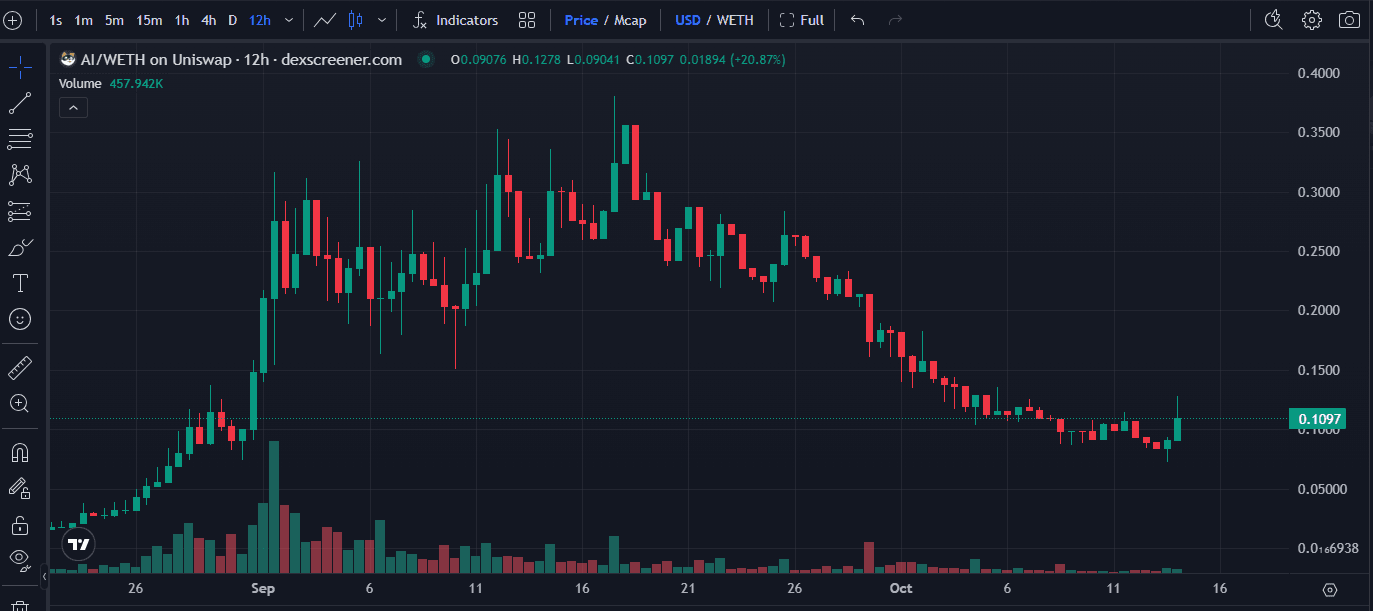
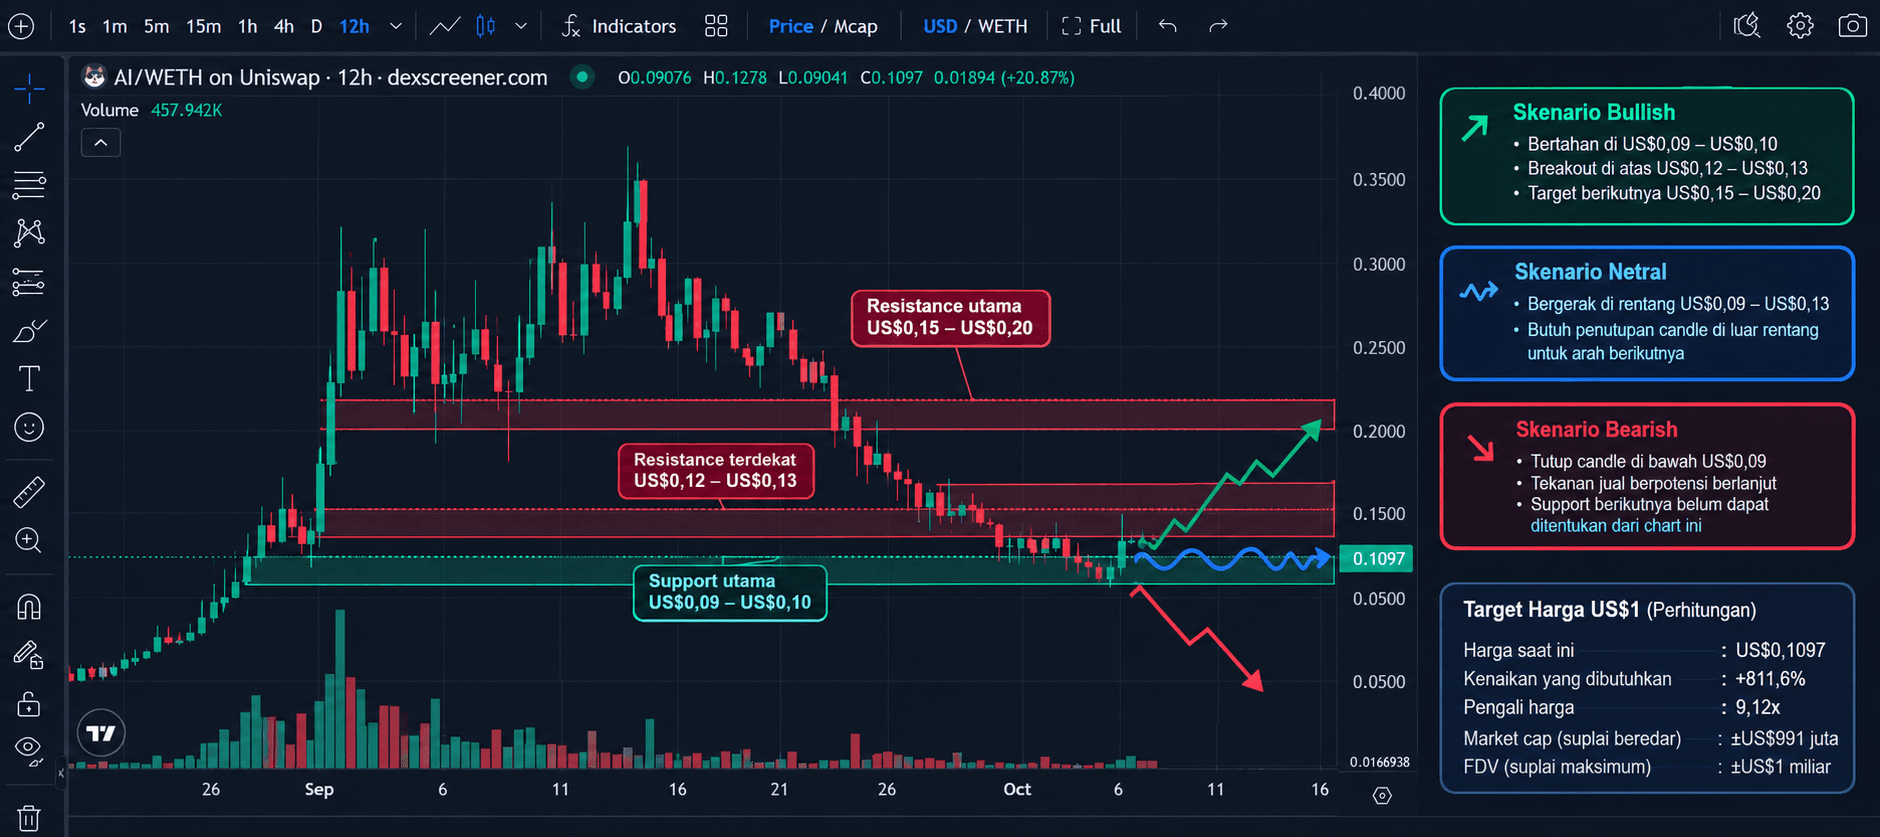
The chart you provided uses a 12-hour timeframe for the AI/WETH pair, while the selected price display is denominated in USD. The latest visible candlestick has an opening price of around US$0.09076, a high of US$0.1278, a low of US$0.09041, and a last price of around US$0.1097.
This data shows a bounce from the lower part of the candle, but it is not enough to confirm a trend reversal. The screenshot does not confirm that the latest candle has closed, so this movement should be treated as provisional.
Artificial Inu Support
US$0.09–US$0.10
Nearest support zone
This area corresponds to the latest candle’s low and the consolidation near the end of the chart. If the price holds above this zone, a short-term recovery remains possible.
Below US$0.09
Weakness signal
A 12-hour candle close below the support area could indicate that selling pressure has regained control. This chart does not provide enough information to identify the next lower support level precisely.
Artificial Inu Resistance
US$0.12–US$0.13
Nearest resistance
This area includes the latest candle’s high and the price zone that must be broken for the bounce to receive stronger confirmation.
US$0.15–US$0.20
Next resistance zone
If the price manages to break through the nearest resistance, this area is worth monitoring based on previous trading levels on the chart. A move into this zone would still require sustained buying momentum.
Overall, the chart structure still shows a series of declines from a peak of around US$0.35 in September toward the US$0.10 area in October. Visible volume was relatively high during the initial surge and then declined during the downturn, so a recovery would be more convincing if accompanied by increased trading activity.
Artificial Inu Price Scenarios
The following scenarios use the 12-hour chart as the basis for short-term analysis. These levels are technical areas to monitor, not guaranteed targets or predictions with specific completion dates.
Bullish scenario
The bullish scenario would strengthen if AI holds the US$0.09–US$0.10 area and then closes a 12-hour candle above US$0.12–US$0.13 on rising volume. If the breakout holds, the US$0.15–US$0.20 area could be the next zone tested.
This scenario weakens if the price falls back below US$0.09 after failing to break resistance. Even if a short-term recovery occurs, a move toward US$1 would still require an approximately 9.12-fold increase from the reference price and cannot be inferred from a single bounce.
Neutral scenario
The price may move sideways if AI remains around US$0.09–US$0.13 without managing a sustained breakout. This would suggest that the market is still seeking a balance between buyers and sellers.
Confirmation of the next direction requires a candle close outside this range, supported by volume. If the price continues to trade within the range, there is not yet a strong technical basis for declaring that a new uptrend has formed.
Bearish scenario
The bearish scenario becomes more relevant if a 12-hour candle closes below US$0.09 and the price fails to reclaim that zone. This could indicate that the latest support can no longer withstand selling pressure.
Because the available chart does not provide enough data to determine the next support accurately, lower downside targets should not be set speculatively. Further confirmation may come from a new swing-low structure, volume during the decline, and price behavior after the breakdown.
Read also: Wormhole (W) Price Surges: Can It Break Through US$0.03?
Artificial Inu Risks to Consider
Artificial Inu carries risks that should be evaluated before using a price target as the basis for a decision. A large percentage gain does not necessarily mean the market is deep enough to absorb large sell orders.
5 Things to Check Before Buying Artificial Inu
- Verify the contract address. Match the token address against the project’s official page and the Robinhood Chain explorer to avoid counterfeit tokens using a similar name or ticker.
- Check pool liquidity. Review market depth, spreads, and estimated slippage for the transaction size you are considering.
- Evaluate holder distribution. Check whether a small number of wallets control a large share of the tokens and whether significant token transfers are taking place.
- Review project activity. Verify claims about utility, development, partnerships, and audits through documentation that can be checked.
- Set risk limits. Create a plan based on loss tolerance, position size, and the conditions that would invalidate the initial scenario.
Another risk arises when the price rises sharply in a short period. Buyers who enter after a surge may face a major correction if momentum fades, while limited liquidity can amplify the impact of selling.
The DEX Screener page also warns that automated security checks are not always accurate. Therefore, automated scan results should not be treated as proof that a contract is completely safe.
Conclusion
A move in Artificial Inu’s price to US$1 is mathematically possible, but the available chart does not yet provide technical confirmation to support that target. From the reference price of US$0.1097, AI would need to rise by approximately 811.6%, while the 12-hour chart still shows a downtrend attempting to recover.
The first things to monitor are whether the price can hold the US$0.09–US$0.10 area and break through resistance at US$0.12–US$0.13 with volume support. To deepen your understanding of the crypto market, you can register on Bittime and learn about assets and their trading risks; do not assume that Artificial Inu is available on the platform without verifying its listing and the correct network.

Bittime is a licensed Digital Financial Asset Trader (PAKD) platform authorized and supervised by the Financial Services Authority (OJK) — where you can buy Bitcoin in Indonesia and hundreds of other crypto assets starting from IDR 10,000. Registration is quick and secure, and you can get started today.
Track the conversion rate for USDT to IDR and real-time price movements for your favorite crypto assets. Everything is available in one crypto investment app that you can download for free from the Play Store.
Ready to get started? Sign up on Bittime now and put your investment strategy into action with a platform trusted by millions of users in Indonesia.
FAQ
Can Artificial Inu reach US$1?
Mathematically, yes, but there is not enough evidence to confirm that the target will be reached. At the reference price of US$0.1097, AI would need to rise approximately 9.12-fold and sustain a market valuation far greater than it had at the time of observation.
What would Artificial Inu’s market cap be if its price reached US$1?
Assuming the circulating supply remains unchanged at around 991.07 million AI, its implied market capitalization would be approximately US$991.07 million. Based on a maximum supply of 1 billion tokens, its FDV would be US$1 billion.
How many times would Artificial Inu’s price need to increase to reach US$1?
From the reference price of US$0.1097, the price would need to rise approximately 9.12-fold, equivalent to an increase of around 811.6%. This calculation does not account for price changes during trading.
What factors affect Artificial Inu’s price?
Factors to monitor include market demand, trading volume, liquidity, holder distribution, verifiable project developments, and crypto market sentiment. None of these factors guarantees a price increase.
What are the main risks of buying Artificial Inu?
The main risks include high volatility, uneven liquidity, slippage, concentrated ownership, and the possibility of a price decline after a surge. Verify the contract, market conditions, and risk-management plan before making a decision.
Disclaimer: The views expressed belong exclusively to the author and do not reflect the views of this platform. This platform and its affiliates disclaim any responsibility for the accuracy or suitability of the information provided. It is for informational purposes only and not intended as financial or investment advice.

.png)