ALTAI Price Prediction: Can Altai the Tiger Break Through US$0.1?
2026-10-14
For ALTAI to reach US$0.10, its price would need to rise approximately 38-fold from the US$0.002627 price shown on the analyzed chart. There is not yet sufficient technical confirmation to support that target, even though the daily candlestick shows a sharp surge.
In the October 14, 2026 snapshot, the price briefly reached US$0.004296 before declining again. This makes buyers’ ability to defend the breakout area more important to monitor than immediately treating US$0.10 as the next target.
Key Takeaways
- For ALTAI to reach US$0.10, it would need to rise approximately 3,707% from the price shown on the chart.
- The US$0.0018–US$0.0022 area is an initial retest zone, while US$0.004296 is the candlestick high that the price would need to surpass.
- Assuming the supply remains approximately 984 million tokens, a US$0.10 price would imply a valuation of nearly US$98.4 million.
Getting to Know Altai the Tiger (ALTAI)
Altai the Tiger is a token on the Solana network that trades in the ALTAI/SOL pair. This analysis specifically refers to the token at the following address:
Gyk9Z93Ri2JUjqES9HTpc7pxCJTLD7vhBhEjBhyApump
This address is different from the pair address, which identifies the liquidity pool where the two assets are traded. Understanding this distinction helps you avoid using data from another token with a similar name or ticker.
The token’s name alone does not establish its utility, the quality of its developers, or the sustainability of demand. Therefore, the discussion below focuses on observable market data and price structure without assuming any unverified project benefits.
Read also: DAWS Price Prediction: Can It Break Through US$0.10?
ALTAI Price and Current Market Conditions
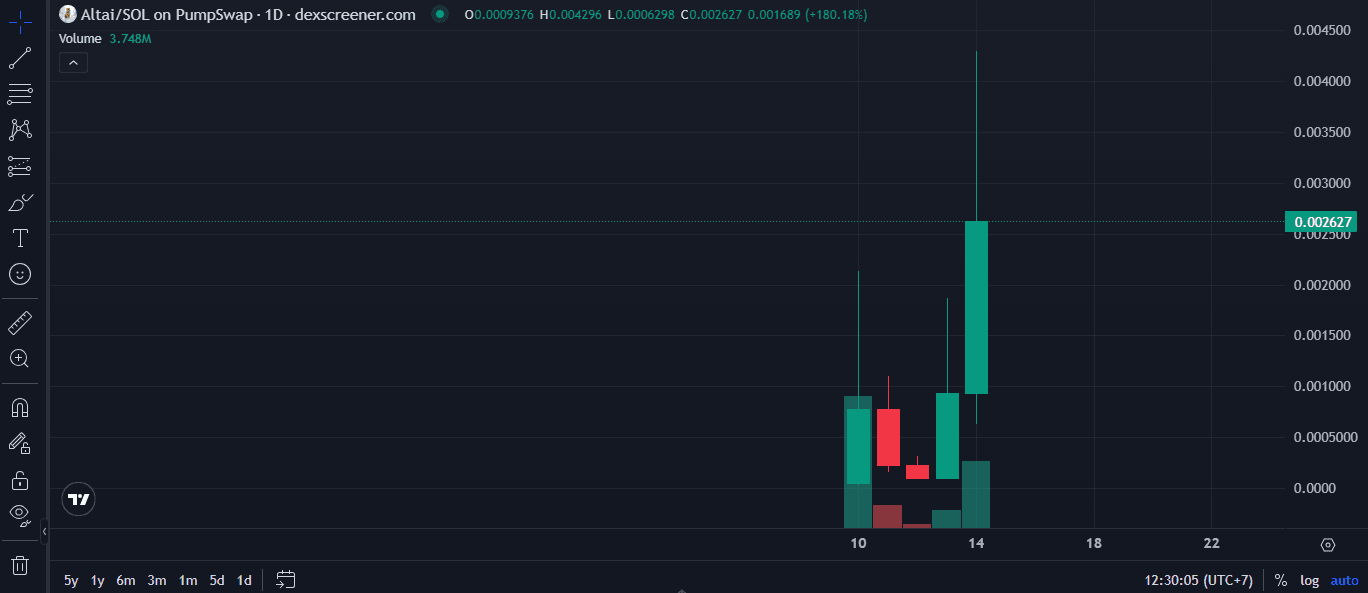
The chart uses the 1D timeframe, meaning each candlestick represents one day. The snapshot shows 12:30:05 UTC+7; the date of October 14, 2026 follows the context in which the image was submitted and the label on the latest candle.
The figures for the latest candlestick are:
- Open: US$0.0009376.
- High: US$0.004296.
- Low: US$0.0006298.
- Last displayed price: US$0.002627.
- Change from the candle’s opening price: approximately +180.18%.
The volume label shows 3.748 million, but the image does not explicitly state the unit. This figure is not treated as verified dollar trading volume, and the candlestick’s change is not equated with the rolling 24-hour price change.
As a separate comparison, the pair page checked on October 14, 2026 showed a price of US$0.002674, liquidity of approximately US$227,000, and both market capitalization and fully diluted valuation (FDV) of approximately US$2.6 million. The page snapshot’s update time was unavailable, so the percentage calculations in this article consistently use the chart price.
Reading the ALTAI Chart: A Strong Surge Followed by Price Rejection
The body of the latest green candlestick shows that the price was well above its opening level. However, the long upper wick indicates that some of the gains toward US$0.004296 had been given back by the time the screenshot was taken.
At US$0.002627, the price was approximately 38.9% below that candlestick’s high. This indicates a wide trading range, not proof that the uptrend has ended.
The image shows only a few candlesticks from October 10 through 14. Such a short history is insufficient to establish a long-term pattern or set precise targets using indicators that are not visible on the chart.
Support: Areas to Retest
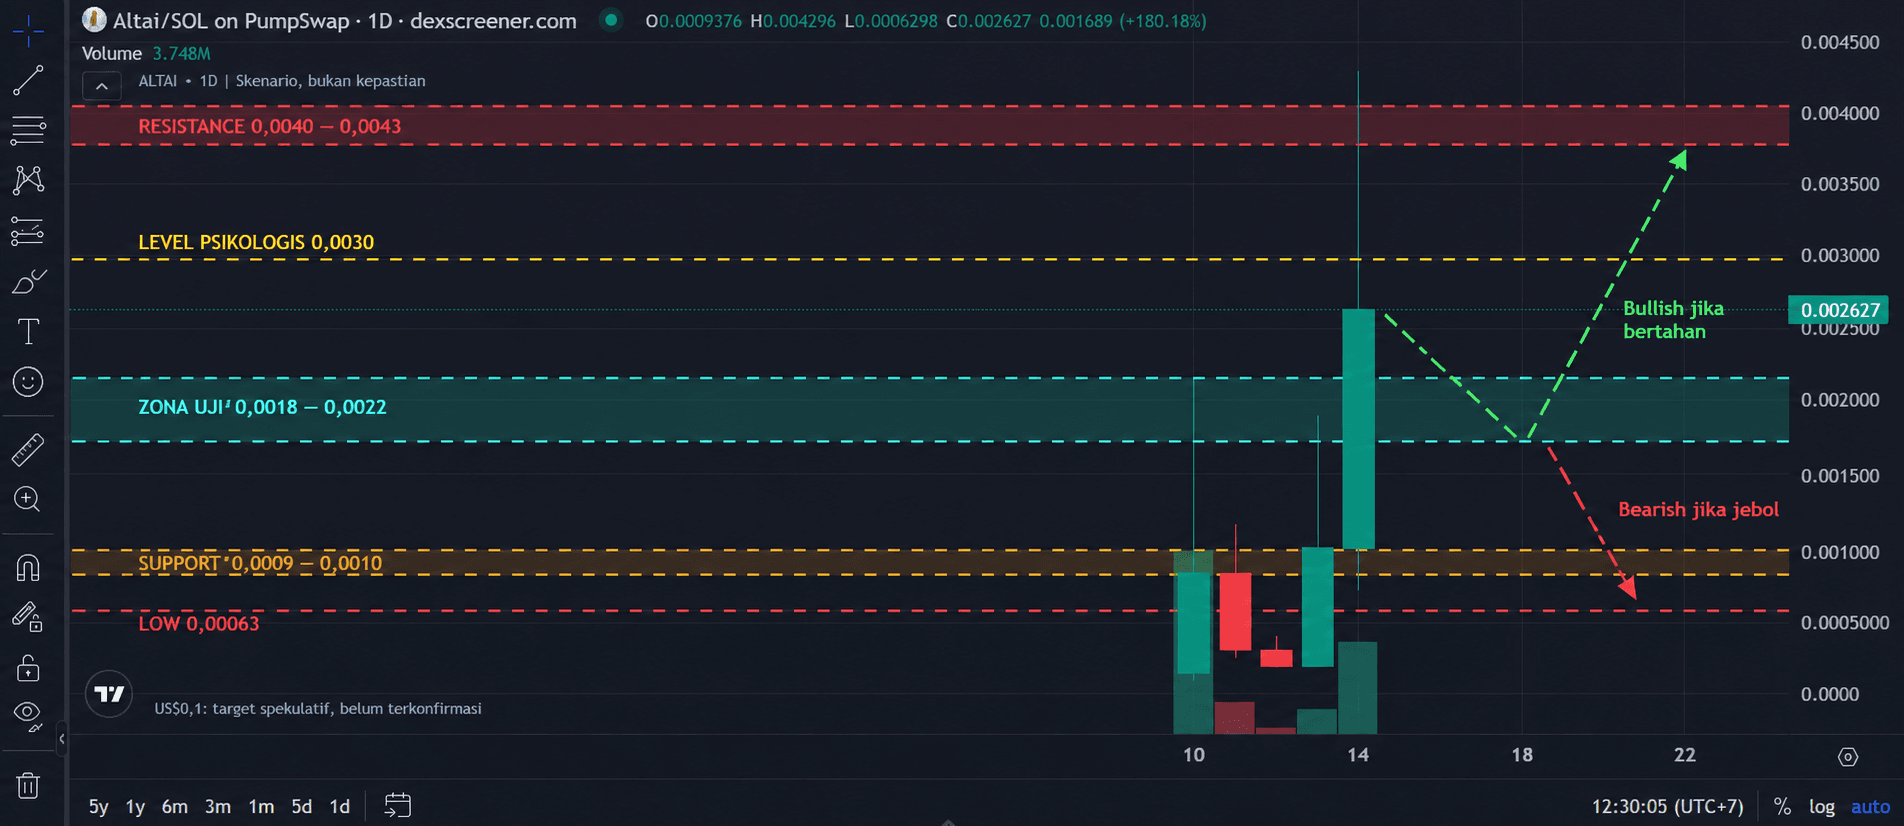
The US$0.0018–US$0.0022 zone lies near the highs of previous candlesticks. After the price moved above it, this area became a potential support zone on a retest, but it cannot yet be considered firmly confirmed support.
If the price falls further, the US$0.0009–US$0.0010 area becomes the next reference because it is close to the latest candlestick’s opening price and the upper portion of the previous candle’s body. Below that, US$0.00063 refers to the latest candle’s low.
These levels are areas to watch, not prices at which the market is guaranteed to rebound. Daily closes and trading activity around these zones will help determine whether buyers are actually defending them.
Resistance: Obstacles Before Considering US$0.10
US$0.0030 can serve as a psychological level to watch initially, rather than a historical resistance level that has been tested repeatedly. A clearer candlestick-based resistance area lies around US$0.0040–US$0.0043.
From the snapshot price, a return to US$0.004296 would require a gain of approximately 63.5%. If that high is surpassed and held, US$0.005 could become the next psychological reference level, not a technical target that will automatically be reached.
Read also: Wormhole (W) Price Surges: Could It Break Through US$0.03?
What Would ALTAI’s Market Cap Be at US$0.10?
Market capitalization is calculated by multiplying price by circulating supply. For this simulation, use approximately 984 million tokens, a rounded version of the approximately 983.91 million reported by the data provider at the time of the review.
Assuming this entire amount represents circulating supply and remains unchanged, the calculation is:
US$0.10 × 984,000,000 = US$98,400,000.
Under those assumptions, a US$0.10 price would correspond to a market capitalization of approximately US$98.4 million. If the figure used represents only total supply, the result should instead be interpreted as FDV, not circulating-supply market capitalization.
The required price increase is calculated using the chart price as the baseline:
US$0.10 ÷ US$0.002627 = approximately 38.07 times.
The percentage increase is (38.07 − 1) × 100%, or approximately 3,707%. This figure shows the scale of the required move, not the probability of achieving it.
The difference in market capitalization is not the same as the amount of money that would need to flow in. Prices are set by marginal trades, while liquidity determines how much transactions can move the price and how easily holders can execute sales.
Read also: STRK Price Rises: What Is the 2027 Target for Quantum-Resistant Starknet?
ALTAI Price Prediction Scenarios Based on the Chart
Bullish Scenario: Holding Above Previous Highs
The bullish scenario gains support if the price retests US$0.0018–US$0.0022 and then holds above it. The next move would need to clear US$0.0030 before retesting US$0.0040–US$0.0043.
A daily close above US$0.0043, supported by buying activity and sufficient liquidity, would strengthen the case for a continued uptrend. This scenario weakens if the breakout quickly reverses and the price falls back below the initial retest zone.
Neutral Scenario: Consolidation After the Surge
The price may fluctuate around US$0.0018–US$0.0030 while forming a new structure. In this situation, readers should wait for clearer trading-range boundaries rather than treating every green candle as the start of a major rally.
Consolidation can help the market build a base, but it may also end in a decline. The next direction can be assessed more reliably after a candlestick closes outside the range and the level is retested.
Bearish Scenario: Losing the Initial Retest Zone
If the daily close falls below approximately US$0.0018 and attempts to recover fail, the US$0.0009–US$0.0010 area becomes relevant again. Further selling pressure could shift attention to US$0.00063.
The bearish scenario weakens if the price reclaims the US$0.0018–US$0.0022 zone and manages to hold it. The image provides no basis for assigning numerical probabilities or determining when any scenario will occur.
4 Factors That Could Influence ALTAI’s Upside Potential
- Sustained demand. A rally requires buyers to remain active after the initial attention fades.
- Liquidity depth. A deeper pool can reduce the price impact of individual trades, although it does not guarantee price stability.
- Holder distribution. Concentration in a small number of wallets can amplify the impact of large sales; the distribution should be examined before drawing conclusions.
- Solana market conditions. Changes in risk appetite and the value of the paired asset can affect the token’s dollar-denominated price.
Social media attention should be treated as an indicator of interest, not evidence of fair valuation. A popular narrative does not necessarily produce sustainable demand or product development.
Read also: XDP Price Prediction for 2026: 16% Rebound and the Key Drivers
Risks to Consider
Slippage can cause an executed trade price to differ from the figure shown on the chart. This risk should be assessed using an execution estimate for your intended trade size, rather than relying solely on the daily percentage gain.
A short price history also means technical levels can change quickly. Accordingly, the levels discussed in this article should be updated after the daily candlestick closes or when new highs and lows form.
To deepen your understanding of crypto assets, you can read educational resources and sign up for Bittime to explore the available services. ALTAI’s availability should be checked separately because this article does not claim that the token is already listed on Bittime.
Conclusion
A price prediction of US$0.10 for ALTAI remains a speculative scenario that would require an approximately 38-fold increase. At present, the chart more strongly supports monitoring the US$0.0018–US$0.0022 zone and a potential retest of the US$0.004296 high as initial evaluation steps.
Use valuation calculations alongside liquidity and candlestick confirmation, and deepen your understanding through Bittime’s educational materials. A mathematically possible price target does not necessarily have sufficient market support to be reached.

Bittime is a licensed Digital Financial Asset Trader (PAKD) regulated and supervised by Indonesia’s Financial Services Authority (OJK) — where you can buy Bitcoin in Indonesia and hundreds of other crypto assets starting from IDR 10,000. Registration is fast and secure, and you can get started today.
Track the USDT to IDR conversion and the real-time price movements of your favorite crypto assets. Everything is available in one crypto investment app that you can download for free from the Play Store.
Ready to get started? Sign up for Bittime now and put your investment strategy into action on a platform trusted by millions of users in Indonesia.
FAQ
Can ALTAI Reach US$0.10?
Mathematically, this target can be modeled, but the chart does not yet provide sufficient evidence that it will be reached. Such a substantial increase would require sustained demand and supportive liquidity conditions.
What Would ALTAI’s Market Cap Be if It Reached US$0.10?
Assuming circulating supply remains approximately 984 million tokens, its market capitalization would be around US$98.4 million. The result would change if circulating supply differed from this assumption.
How Many Times Would ALTAI’s Price Need to Increase to Reach US$0.10?
From the US$0.002627 price shown in the image, it would need to rise to approximately 38.07 times that level. That represents an increase of approximately 3,707%, not 3,807%.
Where Are ALTAI’s Support and Resistance Levels?
The initial potential support zone is US$0.0018–US$0.0022, while the main resistance area is around US$0.0040–US$0.0043. Both are based on a short daily chart history and require further confirmation.
Does a 180% Increase Mean ALTAI Will Keep Rising?
No. That figure represents the candlestick’s change from its opening price to the snapshot. The long upper wick also shows that the price had pulled back from its high during the same period.
Disclaimer: The views expressed belong exclusively to the author and do not reflect the views of this platform. This platform and its affiliates disclaim any responsibility for the accuracy or suitability of the information provided. It is for informational purposes only and not intended as financial or investment advice.

.png)