FET Coin Price Prediction 2026: Can It Reach US$1?
2026-10-05
Prediction of FET Coin price in 2026 towards US$1 faces a crucial test after the price in the daily chart reached US$ 0,2665.
The price position above the two exponential moving averages, accompanied by strengthening momentum indicators, indicates a well-maintained recovery structure.
However, reaching one dollar requires an increase of about 275,2% from the price.
Is the signal on the chart strong enough to support that target, or are the immediate opportunities still limited to the US$0.30 area?
The following analysis uses the attached chart snapshot, not real-time prices. Indicator values and technical levels may change after the next candle forms.
Key Takeaways
FET price of US$0.2665 is above the 9 EMA and 26 EMA, supporting the bullish structure on the daily chart.
US$ 0.2736 is the closest testing level before the US$ 0.28–US$ 0.30 area.
The FET target of US$1 requires a 275.2% increase and is not yet confirmed by the available charts.
FET Price Structure Shows Recovery
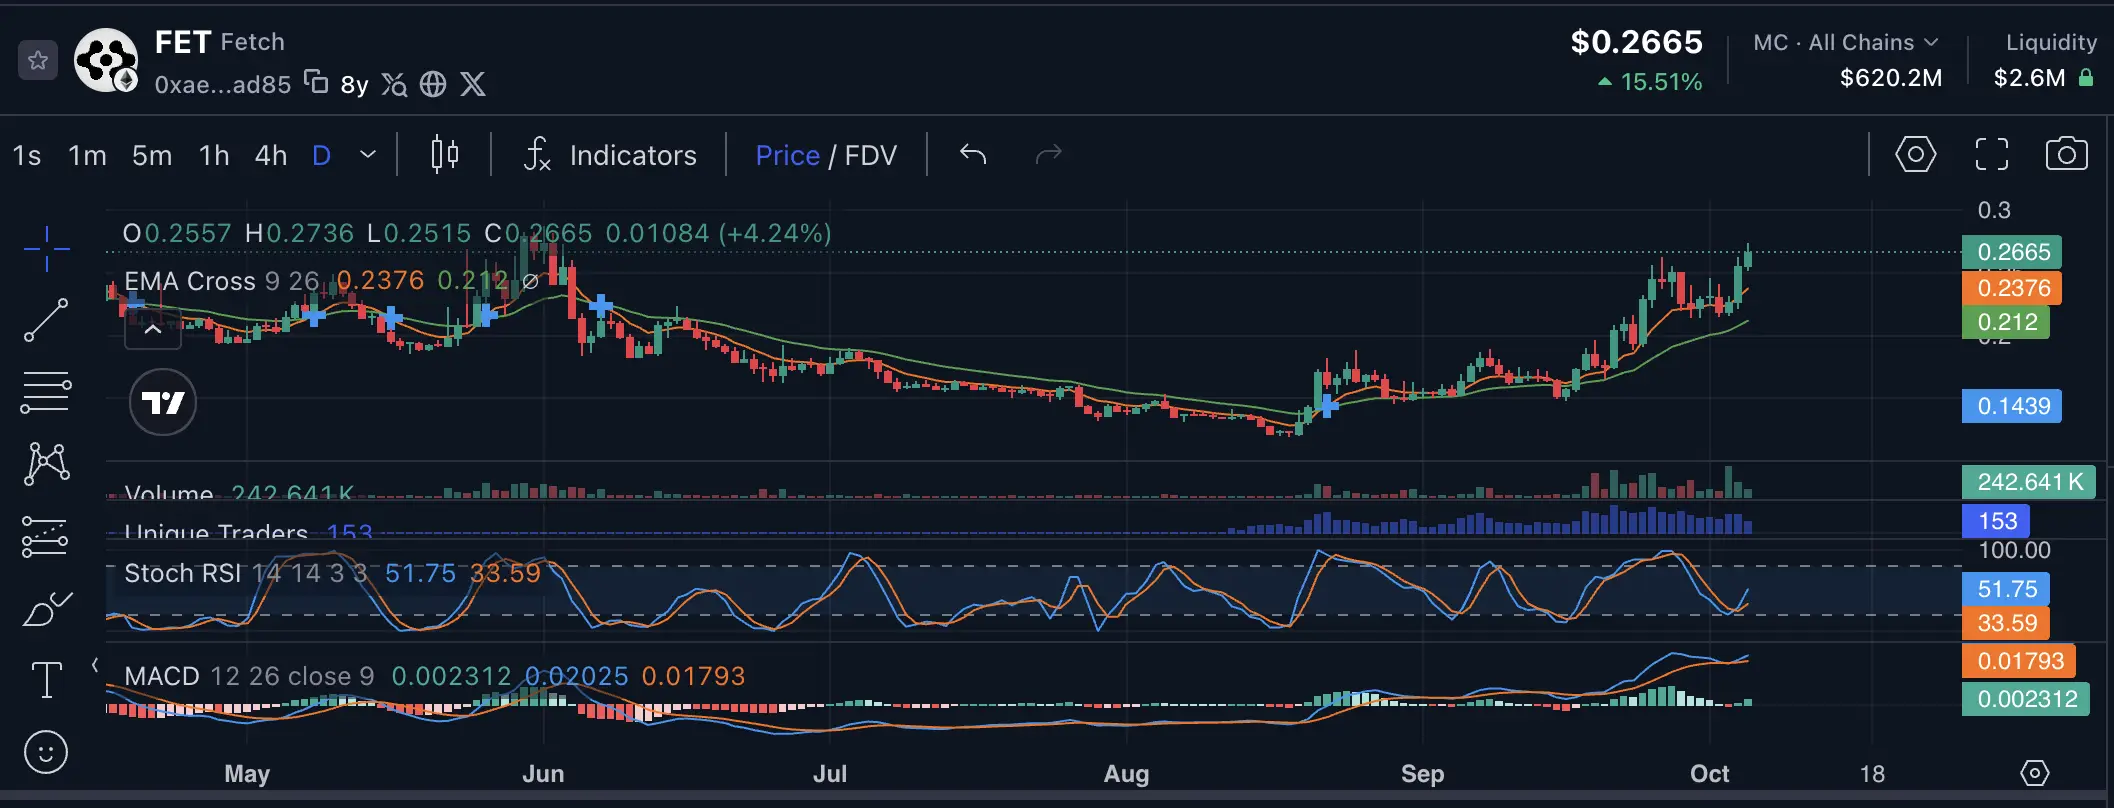
The chart shows a price decline for several months before a recovery began to form from the low area in August.
In the latest section, the price formed a series of peaks and valleys that tended to increase.
The last candle shown has the opening price US$ 0,2557, highest US$ 0,2736, lowest US $0,2515, and the last price US$ 0,2665.
Recorded candle changes 4,24%, although the value can still change if the candle has not yet finished.
The last price is below the highest point of the candle.
This means buyers have successfully pushed the price higher, but haven't maintained the entire gain to its peak. The US$ 0.2736 area serves as an initial reference point for assessing the continuation of momentum.
Read Also: How to Buy Fetch.ai (FET) | FET to IDR | FET to USDT
FET EMA Strengthens, but Correction Remains Open
EMA 9 is at US$0,2376, while the EMA 26 is a tUS$0,2120. The price is above both, while the short EMA also crosses the long EMA. This arrangement is consistent with a bullish trend during the observation period.
However, the price of FET is already around 12.2% above EMA 9 And 25.7% above EMA 26. This distance indicates a strong increase and opens up the possibility of the price returning close to the average.
A correction towards the EMA 9 does not automatically end the uptrend.
What is more decisive is whether buyers are able to hold the area and form the next recovery.
Read Also:5 Best AI Tokens for Crypto Futures Trading
Stochastic RSI and MACD Support Continuation of Momentum
Stochastic RSI shows the K line on51,75, above line D on 33,59 Both appear to have reversed upwards after previously dropping to the lower area, indicating a recovery in short-term momentum.
This indicator is a Stochastic RSI, not a regular RSI.
Therefore, its reading cannot be equated with conventional RSI values or used alone to ensure room for price increases.
MACD FET also shows a positive configuration.
The MACD line is at 0,02025, beyond the signal line 0,01793, with a positive histogram0,002312.
This position supports buyer strength, but the indicator gap still needs to be monitored because a narrowing could signal a slowdown in momentum.
Read Also:10+ Best AI Coins 2026: Here's a List of Artificial Intelligence-Themed Cryptocurrencies!
FET Support and Resistance are the Determinants
FET technical analysis is currently more useful for mapping out nearby price tests than directly setting annual targets.
The EMA-based FET support value will move following price changes.
Meanwhile, the FET resistance area of US$0.28–US$0.30 is a chart interpretation zone, not a definite price limit that will hold back the increase.
Let's start trading crypto from the biggest assets such as BTC/IDR and ETH/IDR directly in the Bittime app.
FET Target Price Scenario Towards US$1: Stages and Confirmation
With a mold price US$ 0,2665on the graph, the FET requires a gain of about 275,2% to return to US$1.
The journey can be mapped through the following stages, starting from the nearest technical level to the more distant psychological target.
US$ 0.2736 and the US$ 0.28–US$ 0.30 area have references on the available charts.
The US$ 0.40, US$ 0.50, US$ 0.75, and US$ 1 prices are psychological stages for evaluating the increase scenario, not a verified historical resistance.
This scenario weakens if the price loses US$ 0.2515 and then fails to hold around the EMA9 at US$ 0.2376.
A further decline towards or past the 26-day moving average (EMA) at US$0.2120 would require a re-evaluation of the trend's strength. The values of both EMAs change with the price.
Thus,U$ S0.28–US$ 0.30 is the closest target which is more supported by the chart, while US$1 remains an optimistic scenario.
This stage does not specify a schedule and ensure all targets are achieved before the end of 2026.
Read Also:What Is Layer 2? Here's How L2s Make Money on Ethereum
How Realistic is the US$1 FET Target?
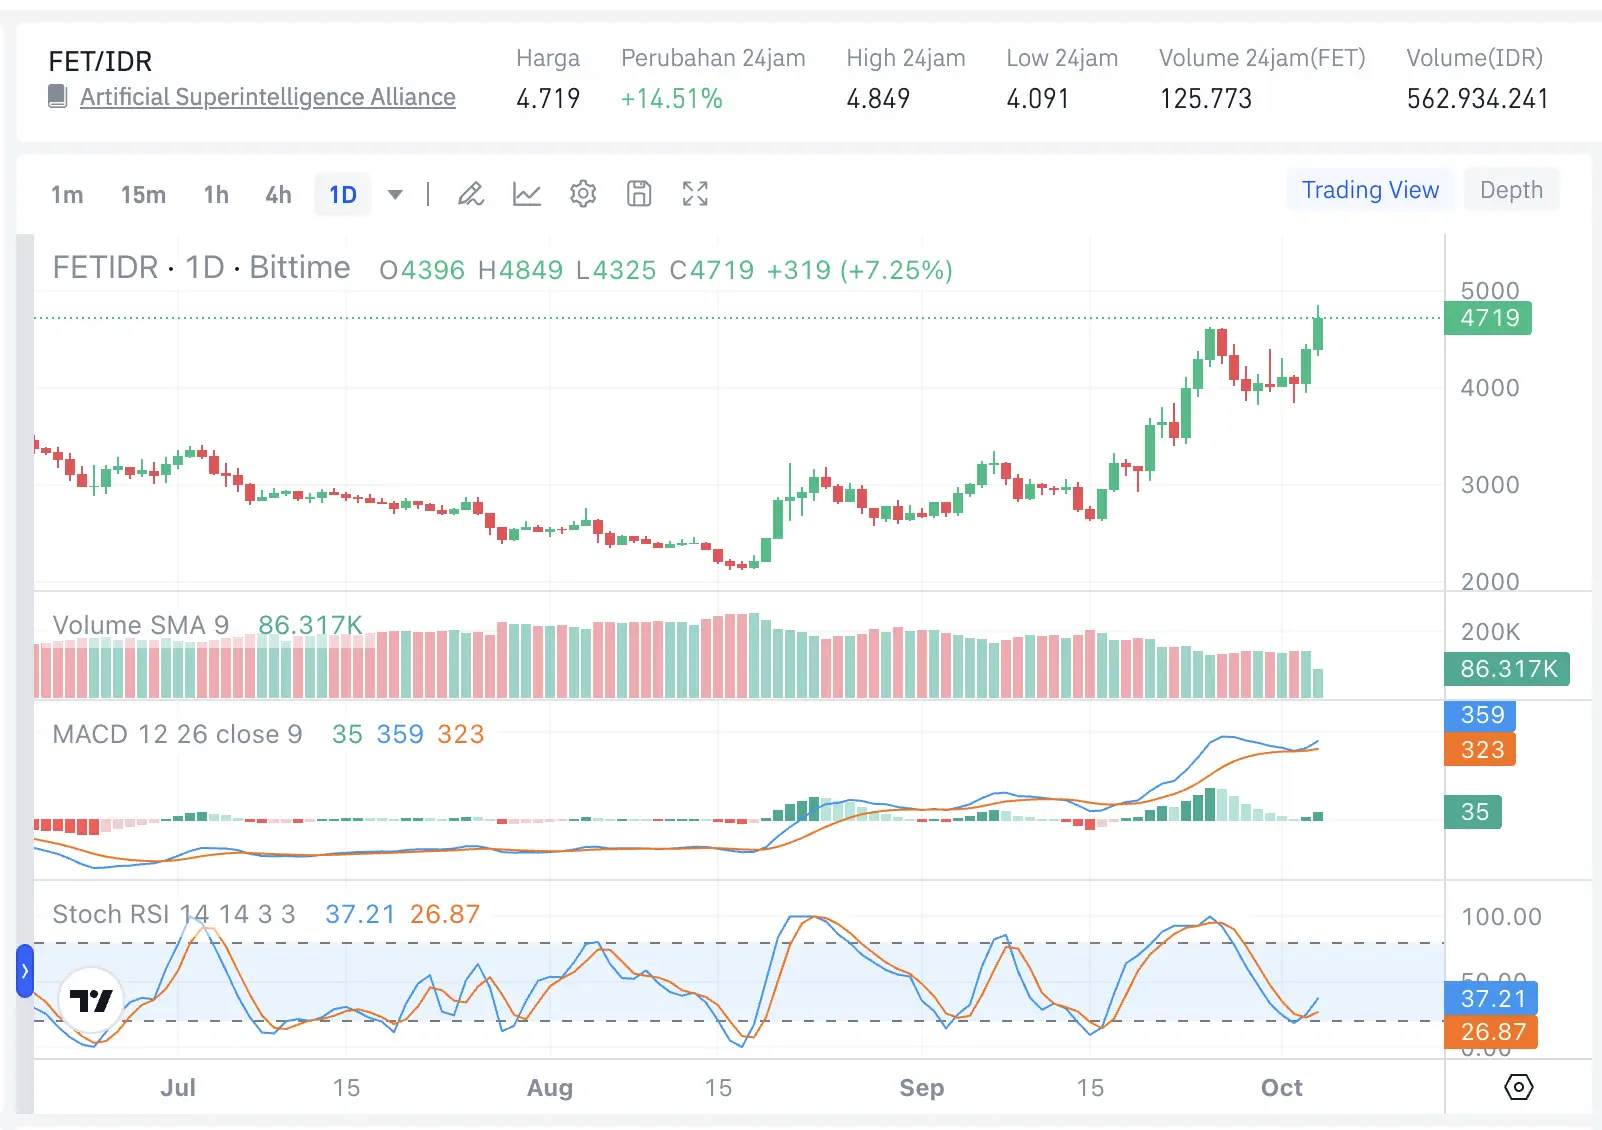
FET to IDR price via Bittime Market
From US$ 0.2665, the price should be around 3.75 times to reach US$ 1.
The 275.2% increase is a huge jump compared to the nearest target of US$ 0.30, which is about 12,6% from the reference price.
The snapshot shows a market capitalization of approximately US$ 620.2 million.
Assuming a constant circulating supply and consistent calculation methods, a price of US$1 implies a capitalization of approximately US$ 2.33 billion.
This figure is a comparison of valuations, not the amount of incoming funds.g must happen.
This target cannot be derived directly from the EMA, Stochastic RSI, or MACD. All three indicators support momentum readings, but they don't provide an estimate of the time or probability of reaching one dollar.
FET's prospects for achieving that target also require an evaluation of the developments of Fetch.ai and the ASI Alliance.
Price charts alone do not demonstrate growth in ecosystem usage or fundamentally increased demand for tokens.
Read Also:Bitcoin vs Ethereum Price Prediction from AI: Scenarios Towards ATH
FET Scenario Before Aiming for a Dollar
The bullish scenario strengthens if the price closes the daily candle above US$2,736 and then maintains that level upon retesting. This opens the possibility of a test of US$0.28–US$0.30.
Conversely, a loss of US$0.2515 increases the risk of a correction towards the 9-EMA. If the 9-EMA fails to support the price, attention shifts to the 26-EMA at the US$0.2120 snapshot.
In conclusion, the charts support recovery, butUS$1 remains an optimistic scenario for 2026.
Register at Bittime to monitor FET market information and check its trading availability before making a decision.
FAQ
Can FET Reach US$1 by 2026?
It's not yet certain. The chart shows bullish momentum, but not enough to determine the probability or timing of reaching US$1.
How Much Increase Does FET Need to Go to US$1?
From US$0.2665, FET requires an increase of approximately 275.2%. The calculation changes if the reference price changes.
What is the Nearest FET Price Target?
US$0.2736 will be an initial test, then the US$0.28–US$0.30 area if the breakout holds.
Where is FET Support on the Daily Chart?
The reference is US$0.2515, followed by the EMA9 at US$0.2376, and the EMA26 at US$0.2120. The EMA values are dynamic.
Is MACD FET Showing Positive Signals?
Yes, in the snapshot, the MACD line is above the signal line with a positive histogram. This condition supports momentum, not guarantees an increase.
Disclaimer: The views expressed belong exclusively to the author and do not reflect the views of this platform. This platform and its affiliates disclaim any responsibility for the accuracy or suitability of the information provided. It is for informational purposes only and not intended as financial or investment advice.

.png)