Bitcoin Dominance Chart Today: BTC.D Analysis and Crypto Market Direction
2026-09-16
Bitcoin Dominance Chart is one of the important indicators for understanding the direction of the crypto market. Through the btc.d chart, traders can see whether capital remains concentrated in Bitcoin or has started moving into altcoins.
Analyzing bitcoin dominance today helps investors understand market sentiment, the potential for altseason, and changes in the crypto cycle. When Bitcoin dominance changes significantly, it usually signals a shift in investor strategy.
Key Takeaways
- BTC.D shows the strength of Bitcoin compared with the entire crypto market.
- Rising Bitcoin dominance often indicates that investors are choosing a relatively safer asset.
- A decline in BTC.D can create opportunities for capital rotation into altcoins.
What Is a Bitcoin Dominance Chart?
A Bitcoin dominance chart is a graph showing the percentage of Bitcoin's market capitalization Bitcoin compared with the total cryptocurrency market capitalization.
Simply put, this indicator measures how much influence Bitcoin has over the overall market. If Bitcoin dominance increases, it means Bitcoin accounts for a larger share of the market compared with other crypto assets.
Conversely, when Bitcoin dominance declines, some capital typically begins flowing into Ethereum and other altcoins.
Understanding Bitcoin dominance helps traders view overall market conditions more broadly rather than relying solely on Bitcoin's price movements.
Read also: Understanding Bitcoin Dominance: How to Read & Use Crypto Charts
Bitcoin Dominance Today: What Does It Signal for the Market?
When analyzing bitcoin dominance today, traders typically look at whether BTC.D is in an upward or downward trend.
Several conditions should be considered:
- BTC.D rises + Bitcoin price rises: This indicates that the market remains focused on Bitcoin and sentiment is relatively strong.
- BTC.D rises + altcoins weaken: Investors tend to reduce their risk exposure.
- BTC.D falls + altcoins strengthen: This can be an early sign of rotation into altcoins.
- BTC.D falls + the entire market weakens: This indicates broader selling pressure.
However, BTC.D is not a standalone indicator for making trading decisions. Traders should also consider Bitcoin's price, trading volume, and global market conditions.
Read also: Bitcoin Price Rising and Falling? Here's How the Dollar Cost Averaging Crypto Strategy Works
Analyzing the BTC.D Chart Using Technical Analysis
To analyze bitcoin dominance, several technical indicators are commonly used.
1. Support and Resistance
Support and resistance levels help traders identify important areas on the Bitcoin dominance chart today.
If BTC.D breaks through resistance, Bitcoin dominance may continue strengthening. Conversely, a decline below support may signal weakening Bitcoin dominance.
2. Moving Average
Moving averages are used to identify the direction of the trend.
If BTC.D moves above the MA 50 or MA 200, the dominance trend remains relatively strong. Conversely, a decline below these areas may indicate a shift in momentum.
3. RSI and Divergence
RSI helps determine whether BTC.D is in an overbought or oversold condition.
Divergence between BTC.D and RSI can also provide an early signal that momentum is beginning to weaken or strengthen.
4. Trend Structure
Traders also pay attention to the following patterns:
- Higher High and Higher Low → indication of an uptrend.
- Lower High and Lower Low → indication of a downtrend.
Analyzing market structure helps avoid decisions based solely on short-term movements.
Read also: 3,400 BTC Return Claim on Liquid Network: Where Is the Evidence?
Does a Decline in BTC.D Mean Altseason Has Begun?
Many traders use a decline in BTC.D as one of the early indicators of altseason. When Bitcoin dominance weakens, investors typically begin looking for opportunities in assets with higher growth potential.
However, a decline in BTC.D does not always mean that altcoins will immediately rise. Bearish market conditions can also cause Bitcoin dominance to decline because the entire market is under pressure.
Therefore, traders should combine BTC.D with:
- Ethereum's performance.
- Total altcoin market capitalization.
- Trading volume.
- Market sentiment.
How to Use the Bitcoin Dominance Chart in Trading
The Bitcoin Dominance Chart should be used as a confirmation tool rather than the primary signal.
A simple strategy:
- Check the direction of the BTC.D trend.
- Compare it with Bitcoin's price movement.
- Observe whether altcoins are beginning to gain volume.
- Use technical indicators before making a decision.
With this approach, traders can understand whether the market is in a Bitcoin dominance phase or beginning to enter an altcoin rotation phase.
Read also: Liquid vs Lightning Network: Advantages and Disadvantages of Bitcoin Layer 2
Crypto Market Update and Latest BTC.D Analysis
BTC.D movements can change quickly due to investor sentiment, global economic conditions, regulations, and developments in the crypto industry.
If you want to follow developments in Bitcoin, altcoins, and the latest crypto market news, you can monitor updates through Bittime to get the latest market information and digital asset analysis.
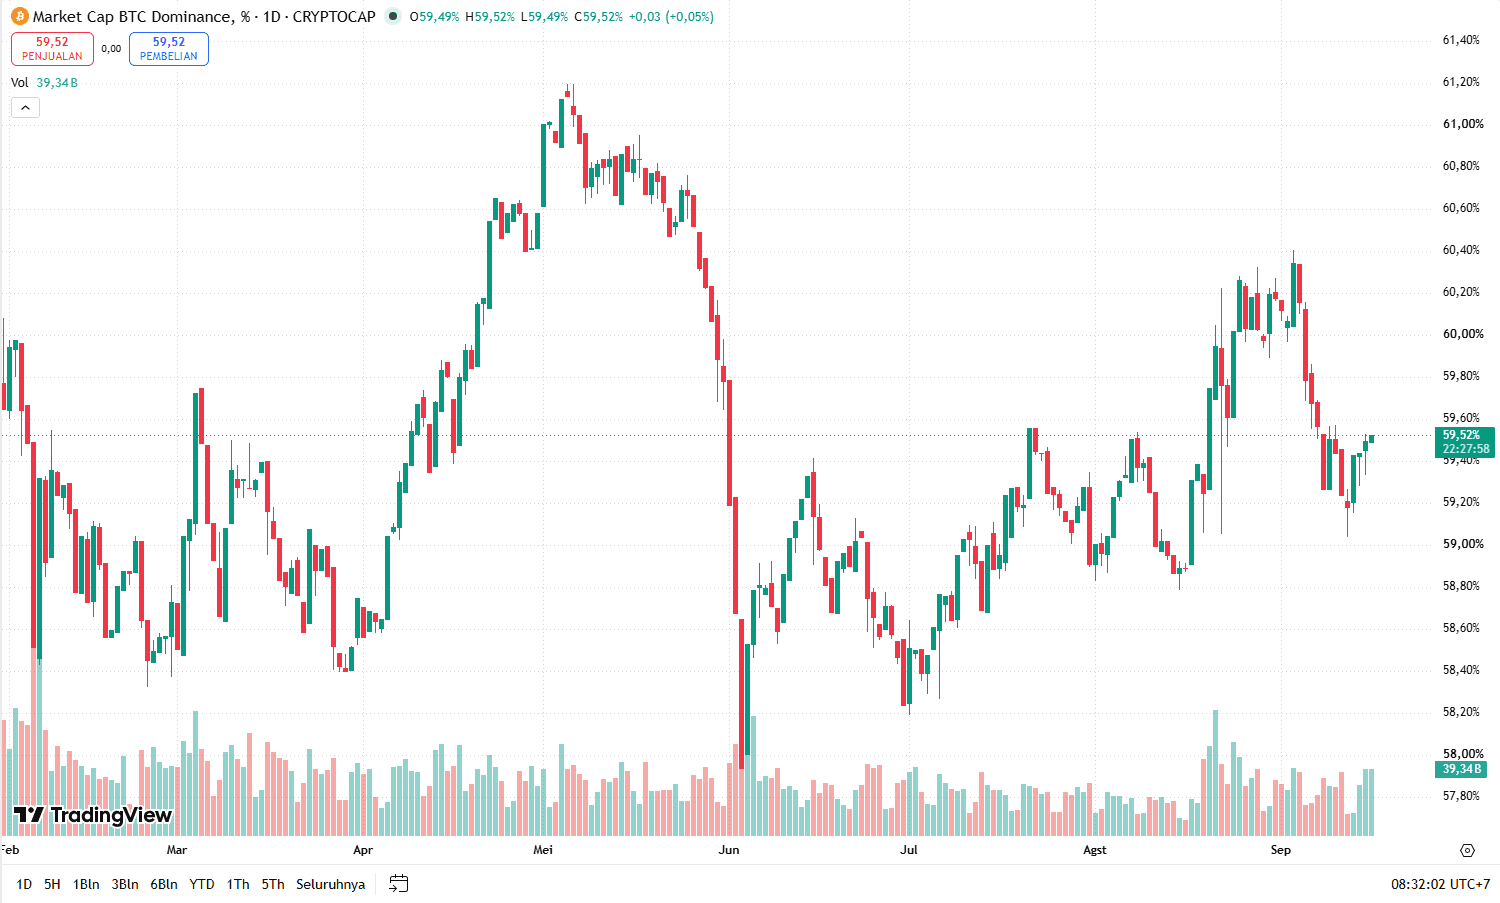
Based on the latest data from the Bitcoin Dominance (BTC.D) chart on the daily timeframe, Bitcoin dominance is around 59.52%. On a weekly basis, TradingView records a change of approximately -0.44%, indicating that BTC.D has declined slightly compared with the previous week.
Real-time data from CoinMarketCap shows BTC dominance at around 59.03%, resulting in a small difference between platforms due to update times and data aggregation methodologies.
From a technical perspective, the 59.20–59.30% area serves as the nearest support because the price has held in this zone several times during recent movements.
If selling pressure increases, the next support is around 58.80–59.00%, while the 58.40–58.60% area represents a lower support based on the structure of movements over the past several months on the chart.
Conversely, BTC.D needs to move back above 59.60% to test the next resistance around 60.00–60.20%, with stronger resistance at 60.40%.
BTC.D movement around 59.5% shows that Bitcoin still holds a dominant share of the crypto market's capitalization, but the weekly decline indicates that some of its dominance momentum is beginning to weaken.
If BTC.D breaks above and holds above 60.00–60.20%, Bitcoin dominance may strengthen again; conversely, a decline below 59.20% could open the way toward lower support and indicate an increase in altcoins' market share.
The 55–57% zone has also historically served as an important support/resistance area for BTC.D, so movement toward this zone should be viewed in the context of the broader trend.
Conclusion
The Bitcoin Dominance Chart is an important indicator for understanding the direction of capital flows in the crypto market. By reading the btc.d chart, traders can determine whether Bitcoin remains the primary choice for investors or whether rotation toward altcoins is beginning.
Bitcoin dominance analysis today should be combined with technical indicators such as support and resistance, moving averages, RSI, and trend structure to make more informed decisions.
Monitor BTC.D developments regularly and use the latest market data before determining an investment or trading strategy.

Bittime is a licensed Digital Financial Asset Trader (PAKD) platform regulated and supervised by the Financial Services Authority (OJK) — where you can buy Bitcoin in Indonesia and hundreds of other crypto assets starting from IDR 10,000. The registration process is fast, secure, and can be started today.
Monitor the USDT to IDR conversion rate and the prices of your favorite crypto assets in real time. Everything is available in one crypto investment app that can be downloaded for free from the Play Store.
Ready to get started? Sign up for Bittime now and execute your investment strategy with a platform trusted by millions of users in Indonesia.
FAQ
What Is a Bitcoin Dominance Chart?
A Bitcoin Dominance Chart is a graph showing Bitcoin's market capitalization as a percentage of the total crypto market.
What Does Rising BTC.D Mean?
Rising BTC.D means that Bitcoin's dominance is increasing compared with other crypto assets. This condition often indicates that investors are favoring Bitcoin.
Does a Decline in BTC.D Mean Altcoins Will Rise?
Not necessarily. A decline in BTC.D can signal rotation into altcoins, but it can also occur when the market is experiencing a downturn.
How Do You Read a BTC.D Chart?
A BTC.D chart can be analyzed through trends, support and resistance, moving averages, RSI, and chart patterns.
Why Is Bitcoin Dominance Important?
BTC.D helps traders understand market sentiment and identify potential changes in the Bitcoin or altcoin cycle.
Disclaimer: The views expressed belong exclusively to the author and do not reflect the views of this platform. This platform and its affiliates disclaim any responsibility for the accuracy or suitability of the information provided. It is for informational purposes only and not intended as financial or investment advice.

.png)