Solana Back at $77: Time to Accumulate or Wait for $70?
2026-07-17
Solana has returned to $77 after losing momentum amid profit-taking. That level briefly served as short-term support, but recent price action suggests that SOL remains at risk of falling toward $73–$74, or even $70, if selling pressure continues.
Key Takeaways
- SOL fell to around US$77 after recording a 4.74% gain in 30 days, so the correction can be read as profit-taking and consolidation.
- The US$76.50–US$77 area is a short-term pivot, while US$73–US$74 and US$70 are the next supports.
- Gradual accumulation is more measured than buying all at once because the market direction has not yet returned to a convincing bullish position.
Solana Price Today: Is It Still at $77?
On July 16, 2026, Solana was trading around US$77 after falling 0.82% over the past 24 hours. SOL traded between US$76.69 and US$78.88, showing consolidation following its previous rally.
Recent movements indicate that the US$77 level has not yet held. On July 17, 2026, the price of SOL stood at around US$75.29 with a daily trading range of US$75.07–US$77.40. Its market capitalization was recorded at approximately US$43.85 billion with a 24-hour trading volume of about US$1.68 billion.
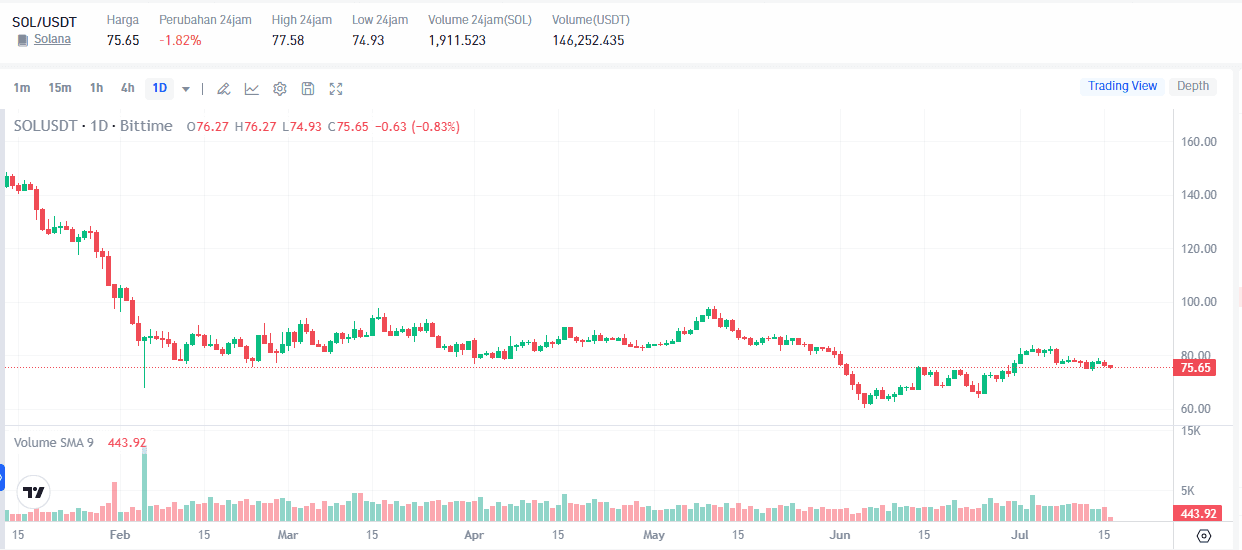
This change is significant for readers searching for "Solana price today." US$77 is now more appropriately treated as an area to be reclaimed than confirmed support.
As long as SOL hasn't closed above US$77 again, buyers haven't fully taken control of the short-term direction. This doesn't automatically signal a prolonged downtrend, but rather indicates that rally momentum is weakening.
Read also: Solana July Prediction: $80 Is a Key Point, $120 Target
Why Did Solana Drop to 77 Dollars?
Solana's decline didn't stem from a single major negative news story. The correction occurred when market participants began to secure profits and hadn't found a new catalyst strong enough to sustain the price above US$80.
Profit Taking After 4.74% Increase
SOL still recorded a gain of around 4.74% in the 30-day period when the correction to US$77 occurred. Therefore, the term "4.7% rally" should be understood as a monthly gain, not a single-day surge.
After a price increase, short-term traders typically begin selling some of their positions to realize profits. This pressure can stall the rally even if the project's fundamentals haven't changed significantly.
Profit taking tends to produce several patterns:
- Price is stuck near resistance.
- Buying volume is no longer increasing.
- Traders started setting lower targets.
- Long leveraged positions are liquidated when support is broken.
- The market moves sideways before establishing a new trend.
In the case of SOL, the failure to hold above US$78–US$80 suggests that demand is not yet strong enough to absorb all the selling pressure.
Why not start investing in and trading Bittime? Register to Bittime – it’s quick, secure and easy.
Volume Remains Strong, but Momentum Weakens
While SOL was hovering around US$77, 24-hour trading volume still reached around US$2.08 billion. This indicates that the market remains active, and a correction hasn't yet equated to a complete withdrawal of investor interest.
However, high volume isn't always bullish. Investors should compare price direction with volume structure. Falling prices amid increasing selling volume indicate distribution, while a slight correction with steadily decreasing volume could signal easing selling pressure.
On July 17, 2026, SOL volume was recorded at approximately US$1.68 billion, down from the previous period. This decrease in activity suggests the market is still awaiting new triggers.
Market Awaits Bitcoin Direction
As a large-cap altcoin, SOL remains influenced by Bitcoin's direction and crypto market sentiment. Bitcoin moving without a strong trend, traders tend to reduce exposure to altcoins or opt for short-term trades.
Solana may have positive network fundamentals, but SOL's price could still weaken if global markets enter a risk-off phase.
Therefore, SOL's technical readings need to be compared with Bitcoin's dominance, stablecoin capital flows, and the performance of Ethereum and other major altcoins.
Read also:JTO Price Predicted to Strengthen Thanks to Revenue Sharing and Buyback
What Is Solana and How Does It Work?
Solana is blockchain Layer 1 designed to power payments, crypto applications, DeFi, NFTs, on-chain trading, and various decentralized programs. SOL is the native asset used to pay transaction fees, stake, and secure the network.
One of Solana's key components is Proof of History, or PoH. This technology isn't a replacement for consensus mechanisms, but rather a cryptographic clock that helps validators efficiently agree on the order of transactions.
PoH generates a chain of proofs that show that a piece of data existed before the next proof was created and that a specific amount of time has passed.
This structure helps the network sequence transactions without requiring all validators to continuously communicate to determine the time of each event.
Solana combines PoH with a staking-based validator system. SOL holders can delegate tokens to validators, while validators process transactions and participate in network security.
In simple terms, how Solana works can be summarized as follows:
- Users send transactions via wallet or app.
- The validator receives and checks the transaction.
- PoH helps provide a verifiable time sequence.
- Transactions are processed through on-chain programs.
- Validators vote on the state of the ledger.
- A transaction reaches confirmation once the network agrees on the outcome.
This architecture allows Solana to serve high-volume applications. However, strong technical performance doesn't necessarily translate into a consistent increase in SOL's price. The price is still determined by demand, liquidity, sentiment, network usage, and broader economic conditions.
Read also: What Is United Oasis Reserve (UXR)? The Solana Coin That Went Viral in 2026
Solana Technical Analysis 2026: Key SOL Levels
Technical analysis does not provide certainty, but it helps map points that may trigger buyer and seller reactions.
US$76.50–US$77 as a Short-Term Pivot
The US$76.50–US$77 area previously served as immediate support. As long as the price remains above this level, SOL has a chance of testing the US$79–US$80 resistance.
As the price then dropped to around US$75.29, the area's function changed. US$77 now became resistance or a pivot point that needed to be recaptured.
The recovery signal will be stronger when:
- SOL has broken through US$77 again.
- The price formed a daily close above US$78.
- Buying volume increased.
- The US$76.50 area was successfully maintained during the retest.
- Bitcoin and the altcoin market also strengthened.
Without those conditions, the rise towards US$77 could end up as a temporary bounce.
US$73–US$74 as Next Support
If SOL still fails to capture US$77–US$80, the US$73–US$74 area will become the next technical support. This zone has previously attracted buying interest and could be where the market tests the strength of demand.
Support isn't a line that guarantees a price rebound. Think of it as a zone where the probability of a buyer response increases.
Signs of a positive response in this area include:
- Rapid price rejection from below.
- Daily candle with a long lower tail.
- Buying volume increased after the decline.
- Price forms a higher low.
- Selling pressure is starting to weaken.
If US$73 is broken with large volume, the chances of heading towards US$70 will increase.
US$70 as Psychological and Intermediate Support
US$70 is a round number that traders can easily identify. This level also serves as relevant intermediate support if the correction from US$77 continues.
Many buy orders tend to cluster around round numbers. However, this also makes the US$70 area vulnerable to liquidity. Prices could briefly drop below that level before rebounding.
Investors who wait right at US$70 face two risks:
- The price reversed before reaching US$70 so the entry opportunity was missed.
- The price broke through US$70 and continued to fall so the purchase was made too soon.
Therefore, decisions should not depend on a single number.
Resistance US$78–US$80
SOL needs to break through US$78–US$80 again to restore short-term bullish momentum. A firm close above US$80 with increasing volume could open the door to a higher price area.
On the other hand, repeated rejections at US$80 indicate that sellers are still defending the area.
 Sumber AI Generated Image
Solana Accumulate at 77 or Wait for 70?
The answer depends on your risk profile and investment horizon. Long-term investors typically don't need to predict the bottom with precision, while short-term traders require more rigorous technical confirmation.
Option 1: Start Gradual Accumulation
Gradual accumulation can be considered if investors still believe in Solana's prospects and are prepared for volatility. Funds are divided into several zones to avoid decisions based on a single price.
An illustrative example of division:
- A small portion when the price was at US$75–US$77.
- Add positions if the price holds at US$73–US$74.
- The next portion is around US$70.
- Reserve fund if the price breaks US$70.
This approach reduces the risk of buying the entire position before the correction is complete. The downside is that the average price can still fall if the market enters a deeper bearish trend.
Option 2: Wait for Confirmation Above US$80
Conservative investors can wait for SOL to break through and maintain US$80. While the entry price may be higher, the probability of a trend recovery may also increase.
This strategy is suitable for buyers who prioritize confirmation over getting the cheapest price.
Confirmation shouldn't just be a momentary spike. Pay attention to daily closes, volume, retests, and overall crypto market conditions.
Option 3: Waiting for the US$70 Area
Waiting for US$70 may offer a more attractive risk-to-reward ratio if that level holds. However, there's no guarantee SOL will ever reach that level.
Buyers waiting for US$70 need to decide on an action before the price arrives:
- How much funding will be used?
- Is the purchase made immediately or in stages?
- What are the plans if US$70 is broken?
- How long will the position be held?
- What is the maximum loss you are willing to accept?
Without such a plan, the US$70 figure remains merely an emotional estimate, not a strategy.
Which is more rational?
For long-term investors, gradual accumulation is generally more manageable than choosing between buying the whole thing at US$77 or waiting for the whole thing at US$70.
For short-term traders, waiting for confirmation above US$77–US$80 or a strong reaction at US$73–US$74 could provide a clearer trading structure.
Avoid using high leverage just because SOL has fallen. A price that looks cheap can become even cheaper if key support fails.
Read also: Solana (SOL) Price Analysis to $100: Challenges and Opportunities
Solana Price Prediction After Correction
Price predictions should be structured around several scenarios, not one fixed target.
Skenario Bearish: US$67–US$70
A bearish scenario becomes more likely if SOL loses US$73–US$74 and Bitcoin weakens as well. Below that area, the price could test US$70, then US$67–US$68 as the next technical zone.
Triggers for a bearish scenario could be:
- A broad crypto market decline.
- Outflow of funds from SOL investment products.
- Decreased network activity.
- Security breach in large applications.
- Macroeconomic pressures.
- Liquidation of leveraged positions.
Neutral Scenario: US$73–US$82
In a neutral scenario, SOL would move sideways while awaiting a new catalyst. The price could repeatedly test US$73–US$74 and US$80 without producing a sustained breakout.
This type of consolidation can last for days or weeks. Traders should avoid chasing prices in the middle of the range without a risk plan.
Start trading SOL/IDR with Bittime here!
Skenario Bullish: US$85–US$92
A bullish scenario requires the price to return above US$80 with stronger volume. Once the breakout is confirmed, SOL could test the US$85 area before moving towards US$90–US$92.
The increase will be healthier if supported by growing network activity, institutional capital flows, positive Bitcoin sentiment, and increased market liquidity.
These ranges are analytical scenarios, not guarantees of investment results.
Read also: Agentic Economy and the Role of Sana AI in the Solana Ecosystem
Solana's Long-Term Outlook
Solana's prospects don't just depend on daily price movements. The network continues to be used for DeFi, stablecoins, payments, tokenized asset trading, NFTs, and consumer applications.
In May 2026, the value of real-world assets on the Solana network reportedly surpassed US$2.8 billion.
The stablecoin supply reached approximately US$16.4 billion, while monthly perpetual volume hovered around US$64.6 billion. Solana's spot ETF in the United States also had approximately US$1.13 billion in assets under management at the end of that month.
These figures indicate that ecosystem activity continues to grow despite the SOL price correction. However, investors need to distinguish network growth from token price increases.
SOL price can find long-term support if:
- Staking demand is increasing.
- The use of stablecoins and payments is increasing.
- The application generates real economic activity.
- The validator infrastructure is becoming more stable.
- Asset tokenization is evolving.
- Developers and users remain steadfast.
- SOL demand is growing faster than token issuance.
Conversely, prospects could weaken if the ecosystem loses liquidity, applications migrate to other networks, network disruptions recur, or usage growth does not create sufficient demand for SOL.
Read also: How AMMs Work on Solana DEX: Why Low Liquidity Can Be Dangerous
Risks of Buying SOL During a Correction
Buying when prices are falling can provide opportunities, but also carries the risk of catching prices that are still in a downtrend.
Risks to watch out for include:
- US$70 support may fail to hold.
- SOL has high volatility.
- Prices are heavily influenced by Bitcoin.
- Ecosystem applications can experience exploits.
- Speculative activity may decline rapidly.
- Regulatory changes can impact demand.
- Staking does not eliminate the risk of price declines.
- Network fundamentals are not always directly reflected in the token.
Investors should determine position size based on their ability to bear losses, not on the belief that prices will return to previous peaks.
How to Monitor Solana Accumulation Opportunities
Before buying SOL, monitor a combination of price and fundamental data:
- Daily closes against US$77 and US$80.
- Price response at US$73–US$74.
- Support strength US$70.
- Changes in trading volume.
- Tren Bitcoin than Ethereum.
- Stablecoin activity on Solana.
- Inflow or outflow of SOL investment products.
- Network transaction and revenue data.
- Ecosystem security news.
Conclusion
Solana returned to US$77 after a 30-day gain of around 4.74% triggered profit-taking. However, data from July 17, 2026, shows the price has moved to around US$75.29, making US$77 the level worth reclaiming.
From a technical perspective, US$73–US$74 is the closest support level, while US$70 is a psychological and intermediate support zone. If SOL breaks through US$78–US$80 again with strong volume, the recovery momentum could extend to US$85 or higher.
Investors don't have to make a clear choice between buying at US$77 or waiting for US$70. Gradual accumulation can reduce the risk of mispricing the bottom, while conservative traders can wait for trend confirmation.
Solana's fundamentals remain supported by DeFi activity, stablecoins, RWA, and institutional adoption. However, the long-term outlook doesn't eliminate the risk of short-term corrections. Monitor price structure and market conditions before making any decisions.

Interested in trading Solana? As well as the SOL/IDR pair, Bittime also offers SOL/USDT to support your trading and investment strategies.
Bittime is a licensed and regulated Digital Financial Asset Trader (PAKD) supervised by Indonesia’s Financial Services Authority (OJK) — where you can buy Bitcoin in Indonesia and hundreds of other crypto assets starting from just Rp10,000. The registration process is fast, secure, and you can get started today.
Track USDT to IDR conversions and monitor your favorite crypto assets in real time. Everything is available in one crypto investment app that you can download for free on the Play Store
Ready to start? Register now on Bittime and execute your investment strategy with a platform trusted by millions of users in Indonesia.
FAQ
Why did the price of Solana drop to US$77?
SOL fell due to profit-taking after posting a 4.74% increase in 30 days. Weak buying momentum and the failure to maintain above US$80 also weighed on the price.
Is $77 still Solana's support?
US$77 previously served as short-term support, but the price has moved below that level. This area now needs to be reclaimed to strengthen recovery momentum.
Can Solana drop to US$70?
It's possible, especially if the US$73–US$74 support level is breached by significant selling pressure. However, US$70 is only a technical scenario and is not guaranteed to be reached.
Is it better to buy SOL now or wait for US$70?
Gradual accumulation can be a more calculated option than buying all at once or waiting for a specific price. The decision still needs to be tailored to your investment horizon and risk tolerance.
What are Solana's long-term prospects?
Solana has a vibrant ecosystem spanning DeFi, payments, stablecoins, RWA, and on-chain applications. Its prospects remain dependent on user growth, network stability, competition, and the ability of these activities to generate demand for SOL.
Disclaimer: The views expressed belong exclusively to the author and do not reflect the views of this platform. This platform and its affiliates disclaim any responsibility for the accuracy or suitability of the information provided. It is for informational purposes only and not intended as financial or investment advice.

.png)