Ethereum RSI Hits Record Low, $1,500 Support: Bottom Signal?
2026-07-07
Ethereum (ETH) currently sits at $1,573, down 46.96% year-to-date and more than 68% from its all-time high of $4,953 reached in December 2025.
Amidst this price crash, two independent analysts identified the same thing: Ethereum's monthly RSI hit an all-time low of ~40, a level never reached even during the 2018 crash, the 2020 COVID-19 pandemic, or the 2022 bear market that took ETH to $880.
The confluence between the all-time low RSI and the symmetrical triangle support at $1,500 creates a setup that has historically been a strong reversal signal.
Key Points
Ethereum (ETH) is currently trading at $1,573, down 46.96% year-to-date and 68% from its all-time high of $4,953, with a market cap of $189.9 billion.
ETH's monthly RSI hit an all-time low of ~40, a level not seen in 10 years, even during the 2018 crash, 2020 COVID, or 2022 bear market.
Historical data of 6 episodes of extreme daily RSI shows 5 out of 6 resulted in positive returns, with a median of +7.2% in 30 days, +20.7% in 60 days, and +25.8% in 90 days.
Monitor Ethereum movements and start your smart investment. Register at Bittime Now, safe and reliable crypto exchange in Indonesia!
Monthly RSI Analysis: All-Time Low
On the monthly chart, Ethereum's RSI has dropped to around 40, the lowest level in the token's 10-year history.
This is the first time in Ethereum's history that the monthly RSI has touched this level, even during the 2018 crash, the 2020 COVID-19 pandemic, or the 2022 bear market that took ETH to $880.
The RSI drop to this level indicates Ethereum's long-term momentum has compressed to an unprecedented level.
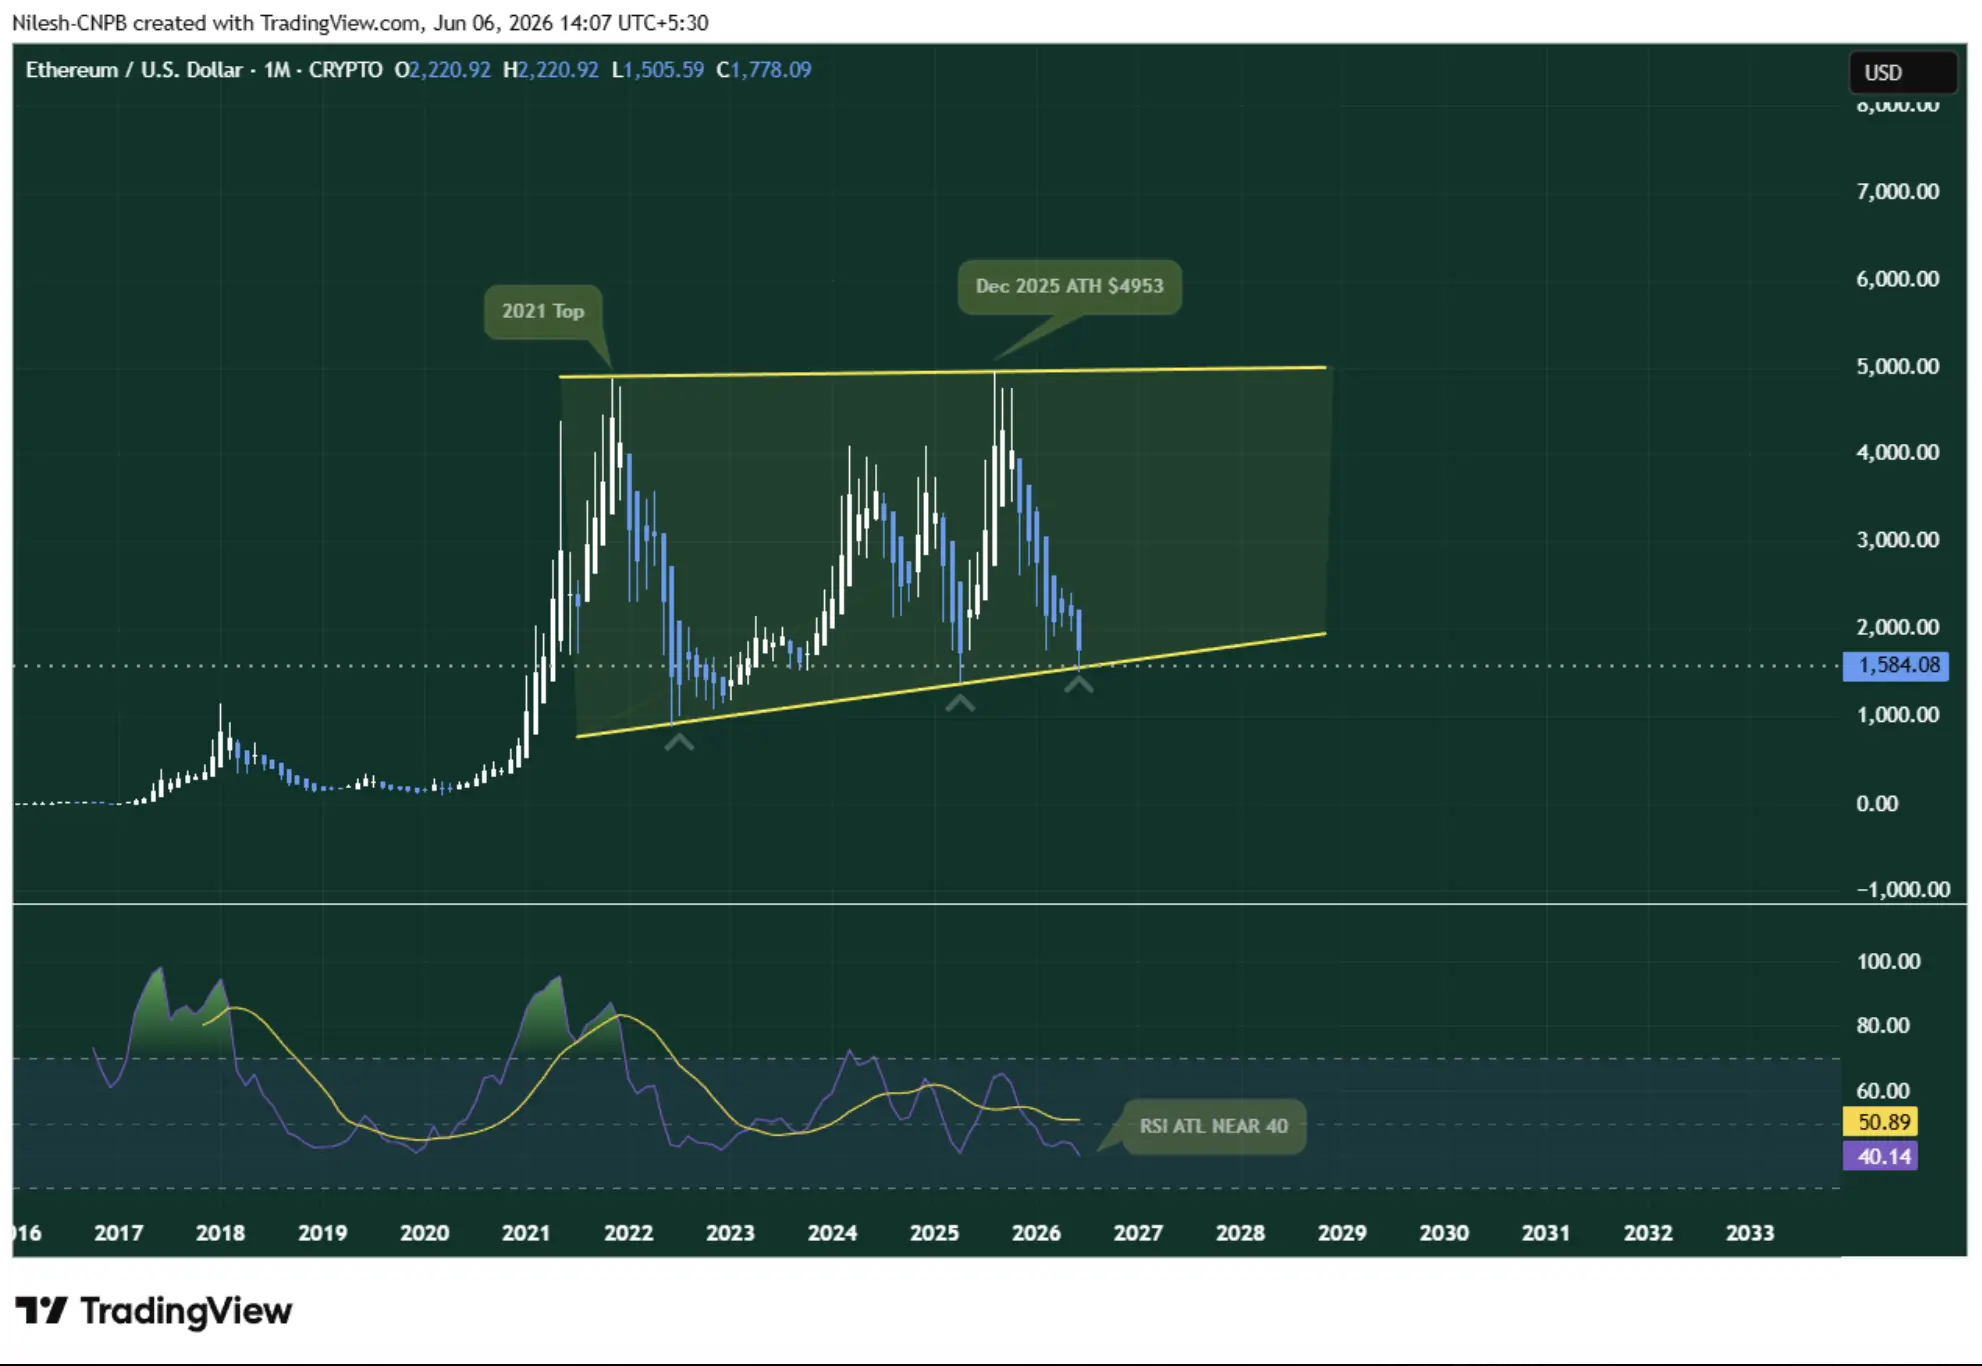
Ethereum $ETH Monthly Chart-Coinsprobe/Source: CoinsProbe/Tradingview
What makes this setup even more powerful is the confluence with price structure: the all-time low RSI occurred simultaneously with a test of the symmetrical triangle support at $1,500.
This combination of extreme momentum exhaustion and structural price support has historically created high-conviction reversal opportunities.
Symmetrical Triangle Support at $1,500
Since 2021, Ethereum has formed a symmetrical triangle pattern on the monthly chart, with a descending resistance line connecting lower highs and an ascending support line connecting higher lows.
This pattern has capped all ETH price movements since 2021, including the 2022 bear market, the 2024 recovery, and the December 2025 ATH that tested the upper boundary.
ETH is currently testing the lower boundary of this triangle around $1,500, the most critical support level defined by the pattern.
This lower trendline has held as support on each previous test, with each bounce resulting in significant upside.
The current test is the most significant because it comes after the largest percentage drop from the ATH in this cycle.
Read Also:ETH Dominance Strengthens: Are Traders Starting to Switch from Bitcoin to Ethereum?
Daily RSI Historical Data: 6 Extreme Episodes
Analyst @sergio_tesla_ performed a quantitative analysis of the 6 deepest daily RSI episodes in Ethereum history since 2021, all cases where the daily RSI dropped below 25.
Data shows:
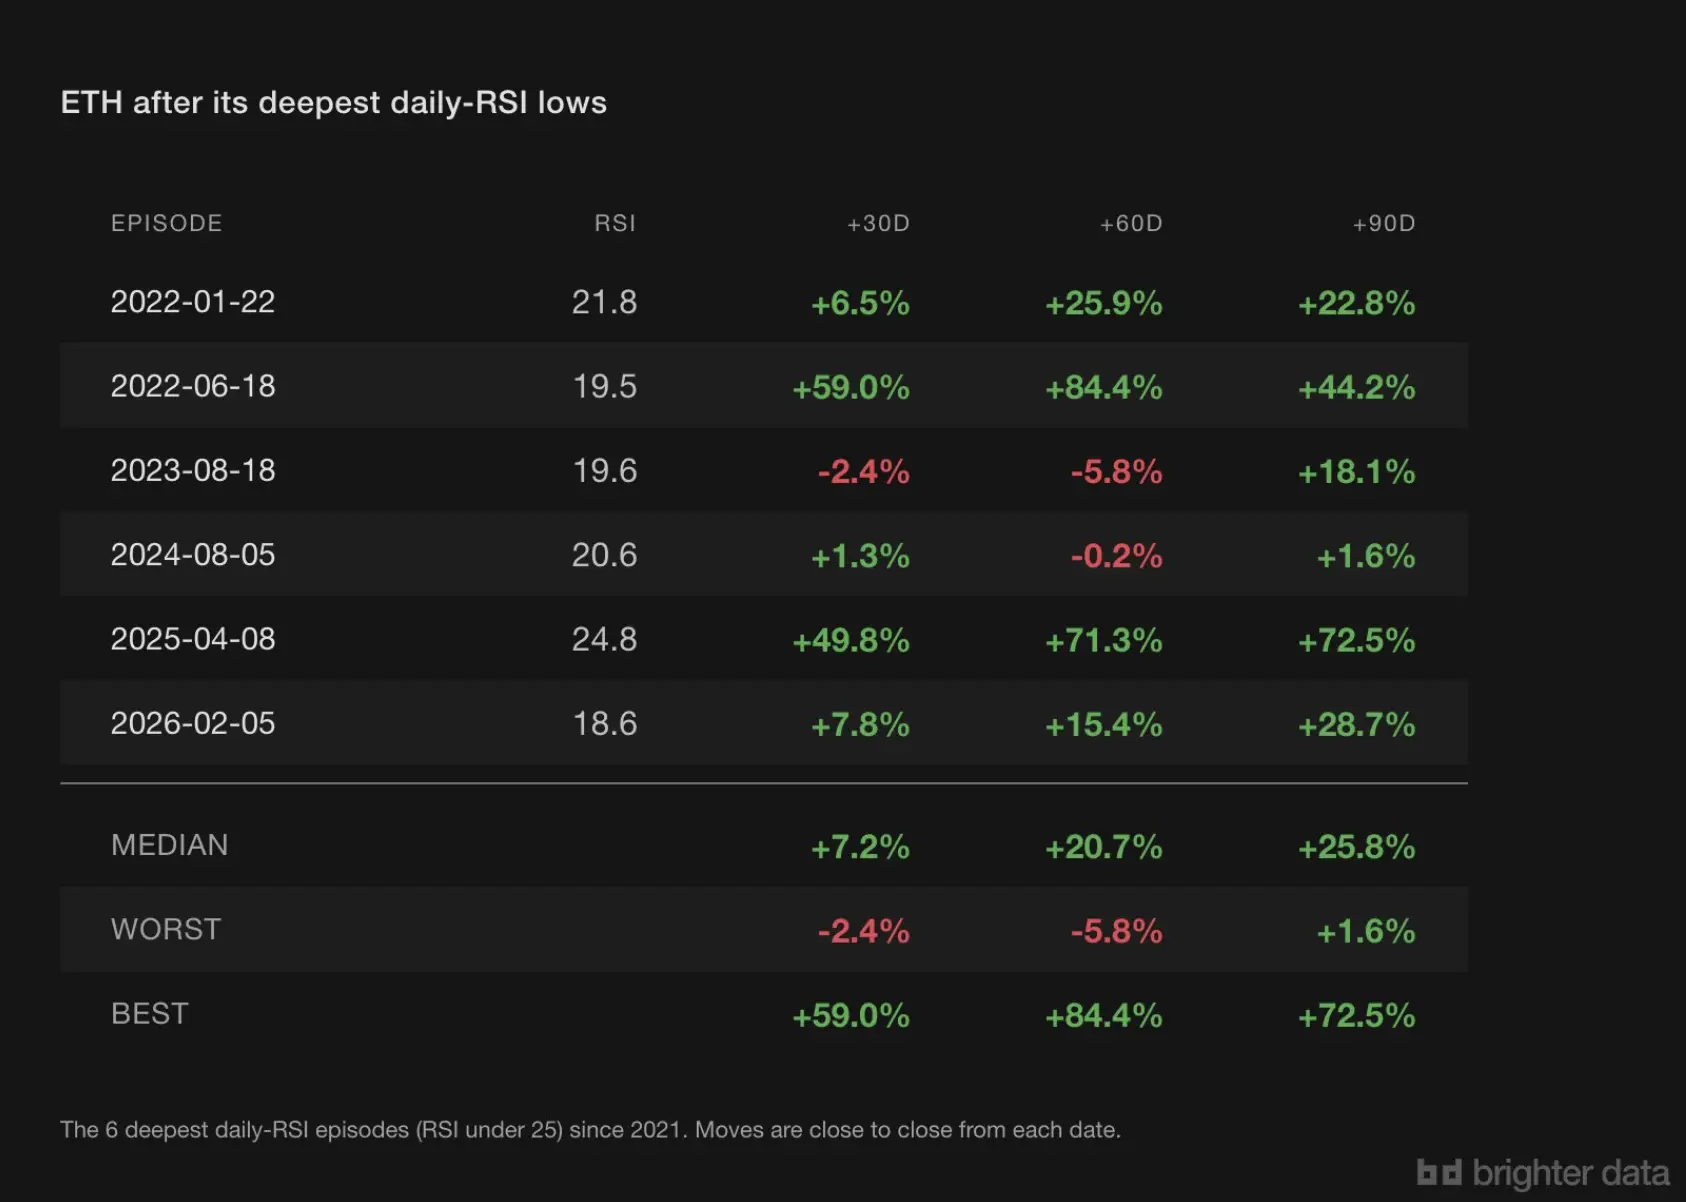
5 out of 6 episodes produced positive returns at 30 days, and 6 out of 6 were positive at 90 days.
Even in the worst case scenario, ETH recovered to +18.1% in 90 days.
This shows that each previous extreme daily RSI reading ultimately resulted in a positive return within 90 days.
Read Also:Convert 1 ETH to IDR - Ethereum to Indonesia Exchange Rate
Fundamental Context
Amidst the price correction, Ethereum core development continues.
Vitalik Buterin recently outlined three concrete technical upgrades: AA+FOCIL for censorship-proof private transactions, EIP-8250 Keyed Nonces for the Hegota fork, and Kohaku access-layer work.
Whale accumulation also continued during the correction, demonstrating the confidence of large investors in Ethereum's long-term prospects.
The combination of extreme RSI readings at structural support, whale accumulation, and continued fundamental development creates a multi-dimensional setup that has preceded Ethereum's historical recovery.
Read Also:How to Buy Ethereum (ETH)
Conclusion
Ethereum at $1,573 with the monthly RSI at an all-time low (~40) and testing the symmetrical triangle support that has held since 2021 is the most significant technical setup in recent years.
Historical daily RSI data shows that each previous extreme episode yielded a positive return within 90 days. The $1,500 support level is a key level to hold, and the extreme RSI provides the momentum foundation for a bounce.
The “ETH is dead” narrative has been proven wrong three times before, data suggests it may be wrong again.

Bittime is a licensed and regulated Digital Financial Asset Trader (PAKD) supervised by Indonesia’s Financial Services Authority (OJK) — where you can buy Bitcoin in Indonesia and hundreds of other crypto assets starting from just Rp10,000. The registration process is fast, secure, and you can get started today.
Track USDT to IDR conversions and monitor your favorite crypto assets in real time. Everything is available in one crypto investment app that you can download for free on the Play Store
Ready to start? Register now on Bittime and execute your investment strategy with a platform trusted by millions of users in Indonesia.
FAQ
What is RSI and why is it important?
The RSI (Relative Strength Index) is a momentum indicator that measures the strength of price movements. An RSI below 30 indicates oversold prices and potential reversal.
What is Ethereum's current monthly RSI?
ETH's monthly RSI is at ~40, its lowest level in history in 10 years.
What is Ethereum's current key support?
Key support is at $1,500, which has been the lower boundary of the symmetrical triangle since 2021.
Does historical data support recovery?
Yes, the previous 6 episodes of extreme daily RSI all produced positive returns in 90 days, with a median of +25.8%.
Why is $1,500 important?
This is a structural support level that has held since 2021 and is a critical level for determining ETH's direction.
What is the future price projection of ETH?
Based on historical data, the median 90-day return after an RSI extreme is +25.8%.
Disclaimer: The views expressed belong exclusively to the author and do not reflect the views of this platform. This platform and its affiliates disclaim any responsibility for the accuracy or suitability of the information provided. It is for informational purposes only and not intended as financial or investment advice.

.png)