XTO Price Prediction: Could It Reach $1? Here's the Calculation and the Risks
2026-10-28
For XTO to reach US$1, its price would need to rise to approximately 79.11 times the US$0.01264 shown on the chart you submitted. There is not yet enough evidence to call this target realistic in the near term, especially as the price is correcting after approaching the US$0.014 area.
The 12-hour chart shows a fairly strong rise before selling pressure appeared on the latest candle. To assess what may come next, we need to separate two questions: the price direction over the next few days and the valuation if XTO actually reaches one dollar.
Key Takeaways
- From the reference price of US$0.01264, XTO would need to gain approximately 7,811% to reach US$1.
- The US$0.0117–US$0.0120 area is the nearest support zone, while US$0.0140–US$0.0145 is a barrier to further gains.
- Long-term targets need to be assessed alongside supply, liquidity, and the sustainability of XTruth Oil rewards.
What Are XTruth Oil and the XTO Token?
XTruth Oil is a Solana token project that promotes USOon rewards for XTO holders. The mechanism described by the project uses trading fees to buy the reward asset and then distribute it to token holders.
Under this model, trading activity helps fund rewards. The distributions need to be distinguished from profits generated by oil production or sales.
The token address used as the reference for this discussion is:
XtogpWjiAgvkemc5gr1auxkh77w3vKgSQN1nxJeJfHt
This address should be checked whenever you open a price dashboard. The name and ticker alone are not enough to confirm that the data you are viewing refers to the same asset.
Read also: DOOD Price Falls After Surging 212%: Is It Still Worth Buying?
Reading XTO's Price on the 12-Hour Chart
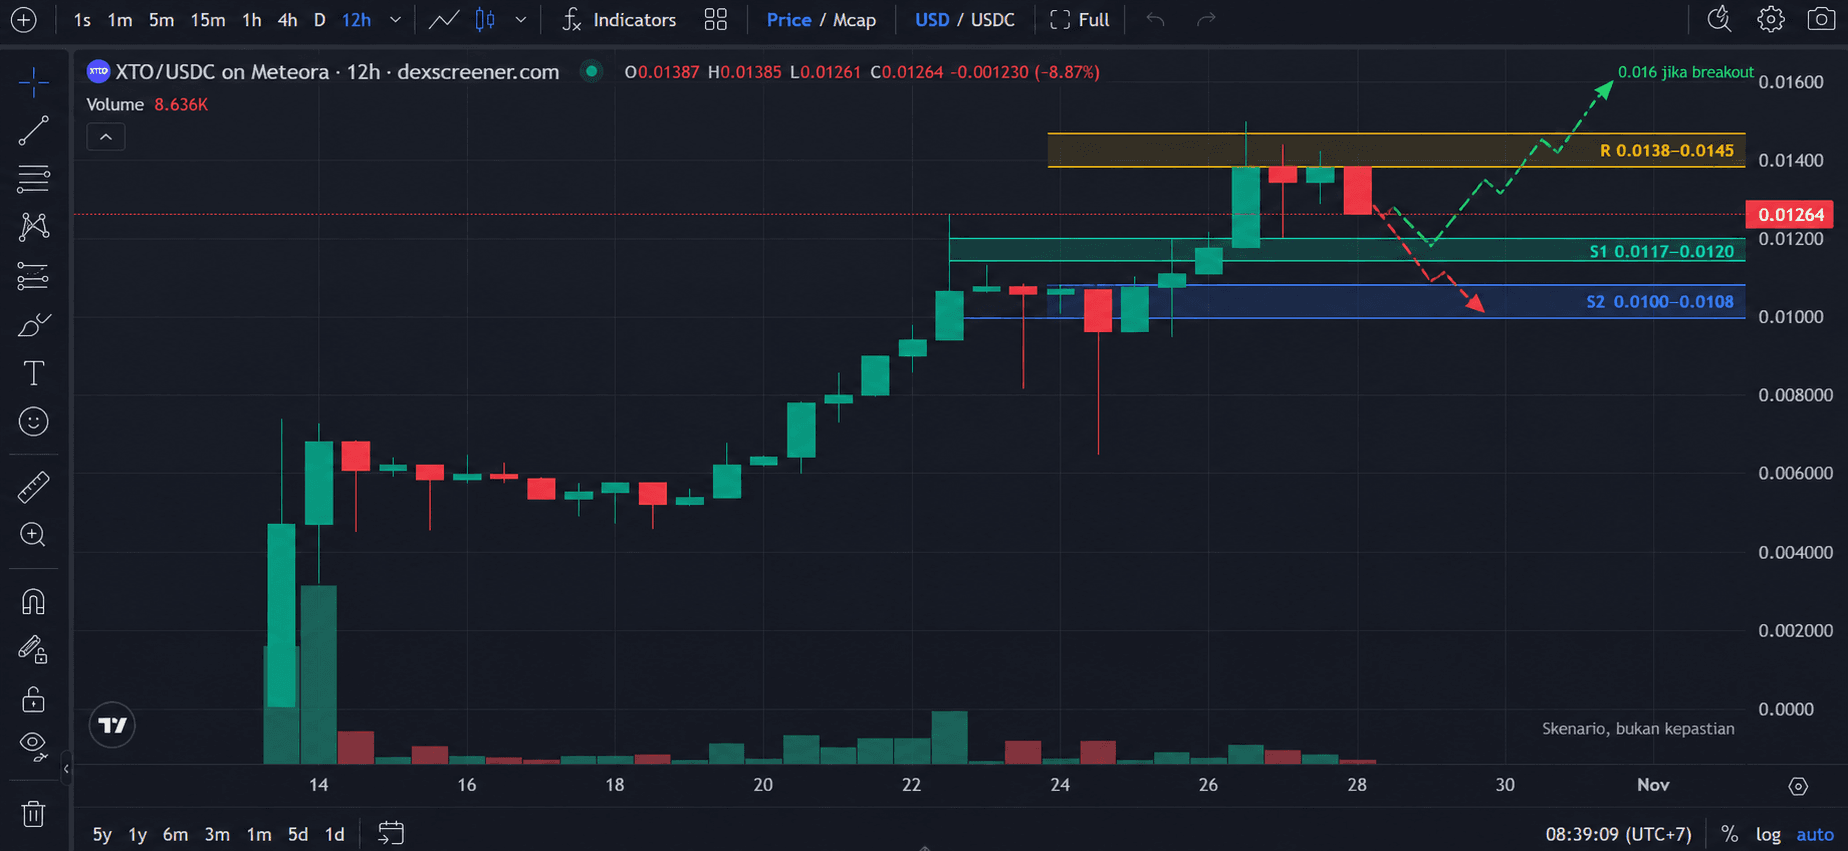
The submitted chart shows the XTO/USDC pair on Meteora, using a 12-hour timeframe and a USD price display. The latest visible price is US$0.01264, with a candle change of approximately −8.87%.
That decline applies to the displayed candle and is not automatically the 24-hour price change. If the candle has not closed, its shape and percentage change may still change.
Visually, the price had previously moved from the US$0.005–US$0.006 range toward US$0.014. After that rise, the latest red candle indicates that sellers began pushing the price down from the local peak.
This correction alone is not enough to conclude that the entire uptrend has ended. A more useful question is whether buyers can defend the area from which the price previously continued its climb.
Support areas to watch
The US$0.0117–US$0.0120 zone is the nearest support area, based on the position of the candles before the latest rise. If the price returns there, watch whether the decline is contained or continues after the 12-hour candle closes.
Below it, US$0.0100–US$0.0108 is the next zone. Several candles on the chart clustered in this range before the price moved higher.
Both areas are visual estimates, not boundaries guaranteed to stop a decline. The short price history also means their strength has not been tested across many market conditions.
Nearest resistance area
The US$0.0138–US$0.0145 zone is a barrier to further gains because it is close to the candle bodies and upper wicks at the latest peak. The price needs to break through this area and hold above it to strengthen the case for continued gains.
US$0.016 can be used as a further level to monitor after a confirmed breakout. However, on the available chart, it has not been established as historical resistance because the price has not visibly tested it.
XTO Price Prediction: Scenarios for the Next Few Days
The following scenarios use the 12-hour chart structure as a reference. Their purpose is to help interpret changing conditions, not to set prices guaranteed to be reached.
Upside scenario: support holds and the peak is broken
A recovery becomes more plausible if the price holds above US$0.0117–US$0.0120 and then retests US$0.0138–US$0.0145. A 12-hour candle close above that zone would be a stronger signal than a brief spike.
After the breakout, watch whether the area holds on a retest. If the price immediately falls back below resistance, the rise risks becoming a failed breakout.
Volume also needs to be compared with several completed candles. The volume of a forming candle cannot be compared directly with a full candle because they do not yet cover the same amount of time.
Sideways scenario: the price remains within a range
XTO could fluctuate between the nearest support and resistance zones if neither side provides a strong push. In this situation, touching the top of the range does not mean a new trend has formed.
Watch where candles close, not just the length of their wicks. A price that repeatedly crosses an area but always returns inside the range indicates that the next direction is still unclear.
Downside scenario: the US$0.012 zone fails to hold
If a 12-hour candle closes below US$0.0117 and the price fails to reclaim it, the risk of a test of US$0.0100–US$0.0108 increases. That area becomes the next point for assessment because it previously contained several consolidation candles.
If the second zone also breaks, the short-term bullish structure weakens further. This chart does not provide a sufficient basis for setting a precise further downside target.
Read also: FOTF Price Prediction: Can It Break $1? Check the Calculation
How Much Would XTO Need to Rise to Reach $1?
Using a reference price of US$0.01264, the calculation is:
Price multiple = US$1 ÷ US$0.01264 = approximately 79.11 times.
The percentage increase is calculated by subtracting one from that result and then multiplying by 100%. The result is approximately 7,811%.
This distinction matters: a price reaching 79.11 times its starting value does not mean a gain of 7,911%. The percentage gain is calculated from the increase above the initial value.
As a simple comparison, a price that doubles has increased by 100%. The same formula is used to calculate how far XTO is from one dollar.
This figure shows the scale of the target, but it does not measure the likelihood of reaching it. To assess whether it is reasonable, the price calculation needs to be extended to valuation.
What Would XTO's Valuation Be at $1?
The explorer records a current supply of approximately 999,999,898 XTO, or close to one billion tokens. Assuming that amount stays unchanged, a US$1 price would imply a valuation of around US$1 billion based on the entire supply.
This is not automatically the market capitalization based on circulating supply. The calculation uses the entire recorded supply, making it closer to a diluted valuation approach on that supply basis.
At the chart price, multiplying by the same supply gives a valuation of approximately US$12.64 million. This comparison is an illustration combining the screenshot price with explorer supply data, not a market snapshot captured at the same moment.
Valuation also does not indicate how much money is available to cash out. When holders sell tokens, the transactions still require liquidity and buyers at an appropriate price.
Reaching a US$1 billion valuation therefore does not mean the project must receive exactly US$1 billion in new funds. Conversely, that valuation does not guarantee that all holders can sell at US$1.
Read also: GIGATENEV Pulls Back: Still Appealing, or Is the Hype Fading?
What Needs to Improve to Make a High Target More Plausible?
Demand that lasts beyond the initial rise
A rally is stronger if buyers keep arriving after the initial attention fades. Check whether activity continues over several days rather than appearing only in one brief spike.
Transaction counts alone do not explain the quality of demand. It is necessary to examine whether activity comes from a diverse set of participants or is concentrated in a few wallets.
Liquidity that can absorb trades
Liquidity determines how much can be bought or sold without moving the price sharply. To assess it, check estimated price impact at several trade sizes without having to execute trades.
Dashboards showing different liquidity figures need to be interpreted according to their methods. Reserves of the paired asset are not always the same as the pool's total value.
Verifiable project information
Announcements of plans need to be followed by evidence of implementation. For the reward mechanism, relevant information includes funding sources, distribution transactions, and the amounts holders receive.
If partnerships or support from other parties are claimed, seek confirmation from the named parties. Promotional material alone is not enough to prove those relationships.
Read also: KIMCHI Coin Price Prediction 2026: Analysis and How to Buy
XTruth Oil Risks That the Chart Does Not Show
A chart helps interpret price activity, but it does not explain the project's full condition. Token distribution, contract control, and the reward mechanism require separate checks.
In an investigation using data through October 21, 2026, reward payments were recorded in 78 of 168 observation hours. This finding is historical and must not be treated as the latest distribution status.
Receiving rewards also does not automatically make an investment profitable. Their value needs to be compared with token price changes, transaction fees, and the sale proceeds that can actually be realized.
Another risk is confusing the asset with a token of the same name. The investigation found several other tokens using the XTO ticker, so their price and valuation data must be kept separate from the token analyzed here.
Finally, one large wallet does not necessarily represent one investor. Before assessing ownership concentration, distinguish pool addresses, custodians, and other wallets whose functions can be identified.
Conclusion
The chart-based XTO price outlook shows a correction after a rise toward US$0.014. The short-term focus is the price response at US$0.0117–US$0.0120 and its ability to move through US$0.0138–US$0.0145.
The US$1 target remains far away, with insufficient supporting evidence to assign it a deadline. The 79.11-times calculation should be read as a measure of distance, while the outlook depends on developments in demand, liquidity, and the project.
If you want to use crypto trading services, you can sign up for Bittime and check the available assets. This article does not confirm XTO's availability on Bittime.

Bittime is a Digital Financial Asset Trader (PAKD) platform licensed and supervised by Indonesia's Financial Services Authority — where you can buy Bitcoin in Indonesia and hundreds of other crypto assets starting from IDR 10,000. Registration is quick and secure, and you can get started today.
Track the conversion of USDT to IDR and the price movements of your favorite crypto assets in real time. Everything is available in one crypto investment app that you can download for free from the Play Store.
Ready to get started? Sign up for Bittime now and put your investment strategy into action with a platform trusted by millions of users in Indonesia.
FAQ
Can XTO reach one dollar?
There is not yet a sufficient basis to confirm that it will. From the reference price on the chart, XTO would need to reach approximately 79.11 times its current value, so this target requires major changes in market conditions.
What XTO price is used in the analysis?
The analysis uses US$0.01264, the latest price shown in the screenshot of XTO/USDC on Meteora with a 12-hour timeframe. This is the price in the screenshot, not a live price update.
Where are XTO's support and resistance levels?
The nearest visual support is at US$0.0117–US$0.0120, followed by US$0.0100–US$0.0108. Resistance is around US$0.0138–US$0.0145; all zones are estimates and can be broken.
Does an 8.87% decline mean XTO's trend has ended?
Not automatically. That figure describes the change in the displayed candle, while assessing the trend requires examining candle closes and price responses at support areas.
Can XTO rewards offset price losses?
There is no guarantee. The decline in the token's value can exceed the rewards received, so the two need to be calculated separately.
Disclaimer: The views expressed belong exclusively to the author and do not reflect the views of this platform. This platform and its affiliates disclaim any responsibility for the accuracy or suitability of the information provided. It is for informational purposes only and not intended as financial or investment advice.

.png)