Uniswap Price Prediction: UNI Could Rise to $6 If It Breaks $4
2026-07-29
The price prediction for Uniswap is once again attracting attention as UNI moves closer to the key resistance level around $4 and tests the 200-day Exponential Moving Average, or EMA. If buyers can push the price above this area with strong volume, UNI may continue rising toward its medium-term target of approximately $6.
However, emerging signs of weakening momentum mean that investors still need to consider the risk of a correction.
Key Takeaways
- UNI needs to break above the $4 resistance level and the 200-day EMA to strengthen the bullish scenario toward $6.
- Uniswap’s activity on Robinhood Chain serves as a fundamental catalyst for protocol adoption and UNI tokenomics.
- A bearish divergence on the RSI indicates that upward momentum is beginning to weaken, meaning the breakout still requires confirmation.
Is Uniswap’s Price Heading Toward $6?
The $6 target is not a projection that will be reached automatically. UNI must first establish a convincing daily close above $4 and the 200-day EMA.
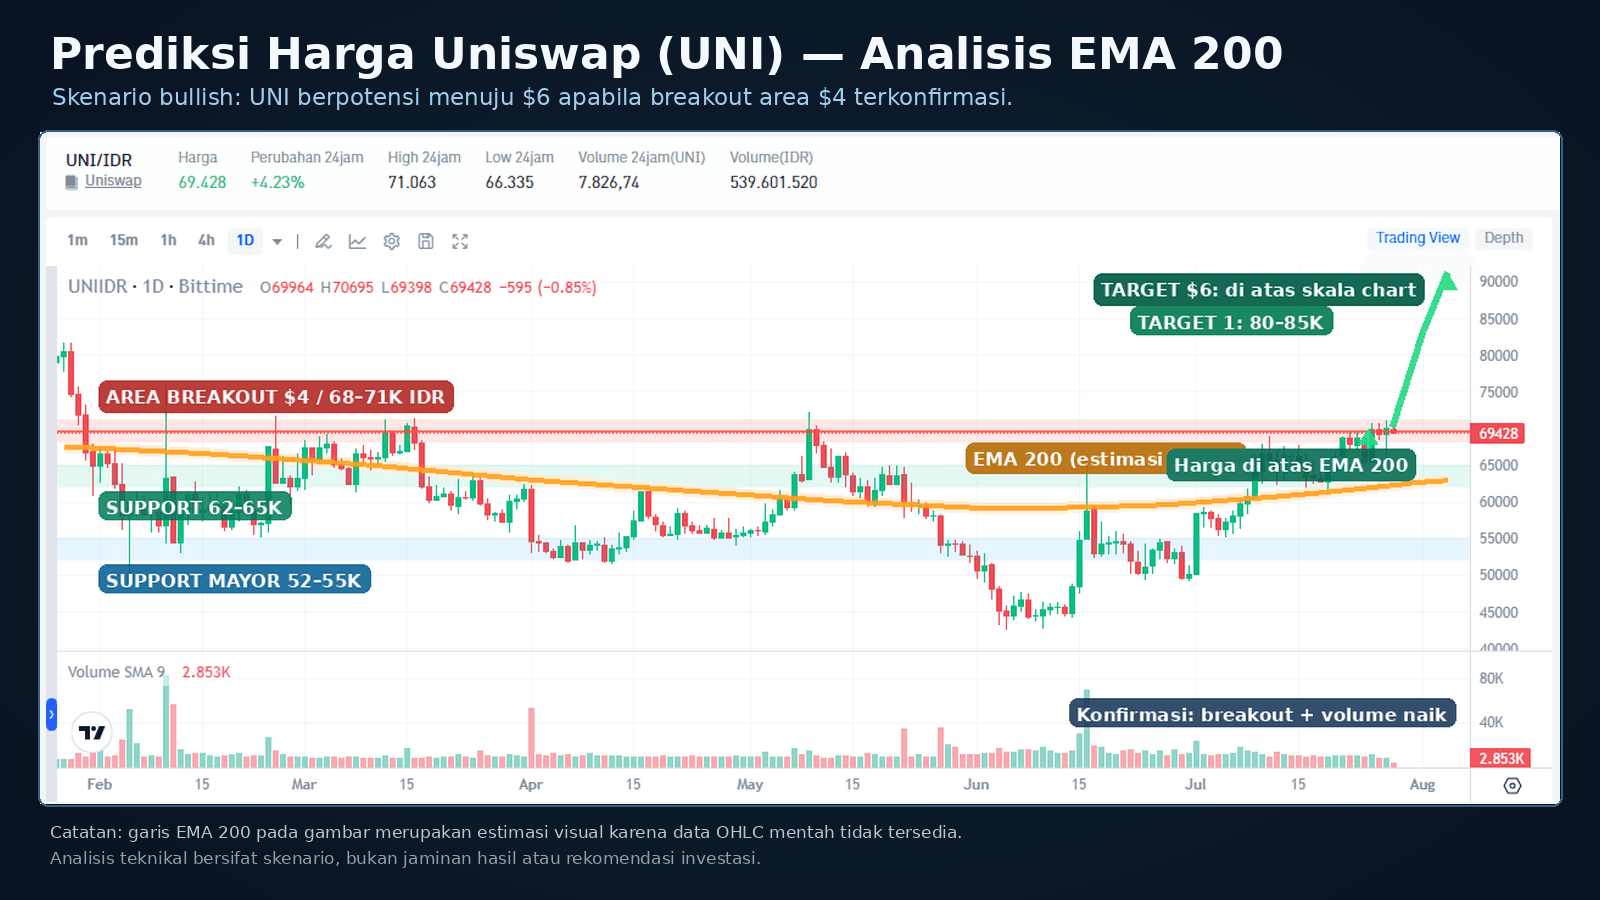
Source: Bittime UNI chart
Ideally, this movement should also be accompanied by an increase in trading volume. Without volume confirmation, a move above resistance risks becoming a false breakout.
Also read: Understanding the UNI Burn Mechanism: The Impact of Uniswap v4 and Robinhood Chain
How Is Uniswap UNI’s Price Performing Right Now?
UNI recorded a gain of approximately 30% during the 30-day period leading up to July 28, 2026. Its daily trading volume was also reported to have reached approximately $183 million, indicating that market interest in the token remains relatively high.
To obtain the latest UNI/IDR price, readers can monitor the Uniswap chart on Bittime, as cryptocurrency prices can change within a short period.
Bittime’s market page also provides information on UNI’s price movements, 24-hour volume, supply, and market capitalization.
Learn step-by-step how to buy Uniswap (UNI) in Bittime market!
Why Is the 200-Day EMA an Important Level for UNI?
The 200-day EMA is commonly used to assess the direction of the long-term trend. A price that remains below this indicator is generally considered to be in a weak trend, while a breakout followed by consistent closes above it may signal a structural shift toward bullish conditions.
UNI is testing the 200-day EMA from below for the first time since November 2025. This makes the area a decisive point between a continuation of the rally and price rejection. What is the impact of Uniswap’s launch on Robinhood Chain?
Uniswap’s expansion to Robinhood Chain broadens user access to on-chain transactions. Within a relatively short period, activity on the network recorded substantial transaction volume, creating opportunities for increased protocol revenue.
Robinhood Chain is also among the networks discussed in the protocol fee activation proposal.
If implemented, a portion of the protocol’s revenue could be used for a UNI buyback-and-burn mechanism, potentially reducing the circulating token supply. How Have Uniswap’s Trading Volume and Revenue Developed?
Uniswap’s activity on Robinhood Chain was reported to have reached a cumulative volume of approximately $10 billion over 30 days. Uniswap also generated approximately $26 million in fees from activity on the network. Overall, monthly fees in July approached $88 million, the highest level since October 2025.
Also read: Uniswap (UNI) Price Prediction: The Major Impact of the UNIfication Proposal
Can UNI Break Above the $4 Resistance Level?
UNI has a chance of breaking above $4 if buying pressure increases and the price can remain above resistance after the breakout. Several confirmation signals to watch include:
- A daily candle close above $4.
- An increase in volume during the breakout.
- The 200-day EMA turning into support.
- The RSI showing positive momentum again.
Register on Bittime to regularly monitor the UNI/IDR chart and price developments. Readers can also check the latest news on the Bittime Blog before developing a trading strategy.
Why Could UNI’s Price Rise Toward the $6 Target?
After the $4 resistance level is broken, UNI may have more room to rise as selling pressure around that area begins to decline. A breakout could also trigger a short squeeze when traders holding short positions are forced to close them.
Under a bullish scenario, UNI could move toward $6 over the medium term. This target should still be viewed as a technical scenario rather than a guarantee of profit. What Does RSI Bearish Divergence Mean for UNI’s Price Movement?
A bearish divergence occurs when the price forms a higher high while the RSI produces a lower peak. This pattern indicates that the price increase is no longer supported by momentum as strong as before.
This signal does not always lead to an immediate decline. However, the divergence gives traders a reason to wait for breakout confirmation before opening a position.
Also read: Uniswap Launches V4: Here Are Its Key Advantages You Need to Know!
Where Is UNI’s Support Level If the Price Corrects?
If UNI fails to break above $4, the next support level to watch is around $3.40. This area could become a point where buyers attempt to maintain the recovery structure. A decline below $3.40 would increase the risk of a deeper correction.
Convert 1 UNI to IDR - Indonesian Rupiah Exchange Rate
Conclusion: Does UNI Have a Chance of Reaching $6?
The Uniswap price prediction toward $6 remains possible, but it depends on UNI’s ability to break above the $4 resistance level and the 200-day EMA. Uniswap’s expansion to Robinhood Chain, growing volume, and the potential strengthening of its tokenomics are positive catalysts.
On the other hand, the bearish RSI divergence and volatile cryptocurrency market conditions still require caution.

Monitor the UNI chart on Bittime, apply risk management, and do not use a single indicator as the sole basis for making decisions.
Bittime is a licensed Digital Financial Asset Trader platform supervised by Indonesia’s Financial Services Authority—where you can buy Bitcoin in Indonesia and hundreds of other cryptocurrency assets starting from IDR 10,000. The registration process is fast and secure, and you can get started today.
Monitor the USDT-to-IDR conversion rate and the real-time price movements of your favorite cryptocurrency assets. Everything is available in one cryptocurrency investment app that can be downloaded for free from the Play Store.
Ready to get started? Register on Bittime now and execute your investment strategy on a platform trusted by millions of users across Indonesia.
FAQ
Can UNI’s price reach $6?
UNI has the potential to reach $6 if it successfully breaks above the $4 resistance level and the 200-day EMA. The breakout needs to be confirmed by increasing trading volume.
What is UNI’s most important resistance level right now?
The $4 area is the main resistance level because it is close to the 200-day EMA. A daily close above this level could strengthen the potential trend reversal.
Where is UNI’s price support?
The nearest support level to watch is around $3.40. If this level is broken, the risk of a further correction could increase.
Does a bearish divergence always cause the price to fall?
Not always. A bearish divergence only indicates that upward momentum is beginning to weaken and must be confirmed by price movements and volume.
Where can I monitor the latest UNI price?
The UNI/IDR price and chart can be monitored through Bittime’s market page. Always check the real-time price because cryptocurrency asset values can change rapidly.
Disclaimer: The views expressed belong exclusively to the author and do not reflect the views of this platform. This platform and its affiliates disclaim any responsibility for the accuracy or suitability of the information provided. It is for informational purposes only and not intended as financial or investment advice.

.png)