REMUS Price Prediction: Down 84%, Will It Rebound or Fall Again?
2026-10-29
The price prediction for REMUS now focuses on the potential for a recovery after a sharp decline. On the chart analyzed, the market panel shows a price of US$0.0002491, down 84.08% over 24 hours, while the five-minute movement is up 21.88%.
This divergence raises a question: are buyers returning, or will the rise be short-lived? To answer it, you need to examine the direction of the daily candle, buy and sell values, and the price areas that may be tested next.
Key Takeaways
- The five-minute rise has not changed the daily chart’s direction, which still shows downward pressure.
- The US$0.00020–US$0.0002116 area is a downside test reference, while US$0.00060–US$0.00080 is a recovery zone to watch.
- The value of sell transactions is greater than that of buy transactions, even though there are more buy transactions.
What Is the Current Price Condition of Remus Coin?
REMUS discussed here is a token on the Solana network with the REMUS/SOL pair on PumpSwap. This analysis uses the figures in the supplied screenshot, so all data reflects conditions when the image was captured, not live prices at the time you read this.
The market panel shows the following changes:
- Five minutes: up 21.88%.
- One hour: down 54.46%.
- Six hours: down 80.83%.
- Twenty-four hours: down 84.08%.
Liquidity is recorded at around US$51,000, while market capitalization and fully diluted valuation (FDV) are each around US$245,000. Twenty-four-hour trading volume reached approximately US$1.5 million.
There is a difference between the panel price, US$0.0002491, and the C value on the daily candle, US$0.0002566. They come from different parts of the display, so they are not treated as identical figures.
The candle change of -76.15% also differs from the 24-hour decline of 84.08%. The daily candle and rolling 24-hour period use different calculation time boundaries.
Read also: XTO Price Prediction: Can It Break $1? Here Are the Calculations and Risks
Remus Coin Analysis: What Does the Daily Chart Show?
The one-day chart shows a rapid rise toward around US$0.0020, followed by three consecutive red candles. The candle highs after the spike appear progressively lower, while the latest candle brings the price back near the area where the rise began.
On the last candle shown, the opening price was US$0.001076 and the high was US$0.001142. The low reached US$0.0002116, while the C value was US$0.0002566.
This position shows that the price is near the bottom of the candle’s range. From a technical-analysis perspective, this does not yet provide strong evidence that buyers can sustain a recovery.
However, the rightmost candle should be treated as still forming until its closing time is confirmed. Its final shape and closing value may still change.
A five-minute rise could mark the start of a bounce, but the period is too short to confirm that the daily trend has reversed. Signs of improvement would be more convincing if the next pullback bottoms at a higher level and the price breaks above the previous bounce high.
Read also: Could USOE Token Reach $0.1? Calculating Its Upside Potential and Risks
Why Is REMUS Still Facing Selling Pressure?
Trading data shows 174,398 buy transactions and 138,519 sell transactions. Looking only at the number of transactions, buying appears to dominate.
However, buy transactions were worth around US$756,000, while sell transactions were worth around US$786,000. This means the value of selling exceeded buying by about US$30,000 during the period shown.
This is why transaction counts alone are insufficient to assess buying strength. Many small purchases can be outweighed by fewer but larger-value sales.
This difference supports the interpretation that REMUS is under selling pressure, but it does not explain all the causes of the decline. Transaction sequencing and liquidity conditions also affect price movements.
This chart does not prove that the team is selling, that specific investors are taking profits, or that the market is being manipulated. Such conclusions require an examination of transactions and token ownership.
Read also: PREDICT Token Price Prediction 2026: The Impact of Futures Listings
REMUS Support and Resistance Areas to Watch
The following levels are estimated areas based on the daily chart, not guaranteed successful trading points. The visible candle history is still short, so each area’s strength needs to be tested by subsequent price movements.
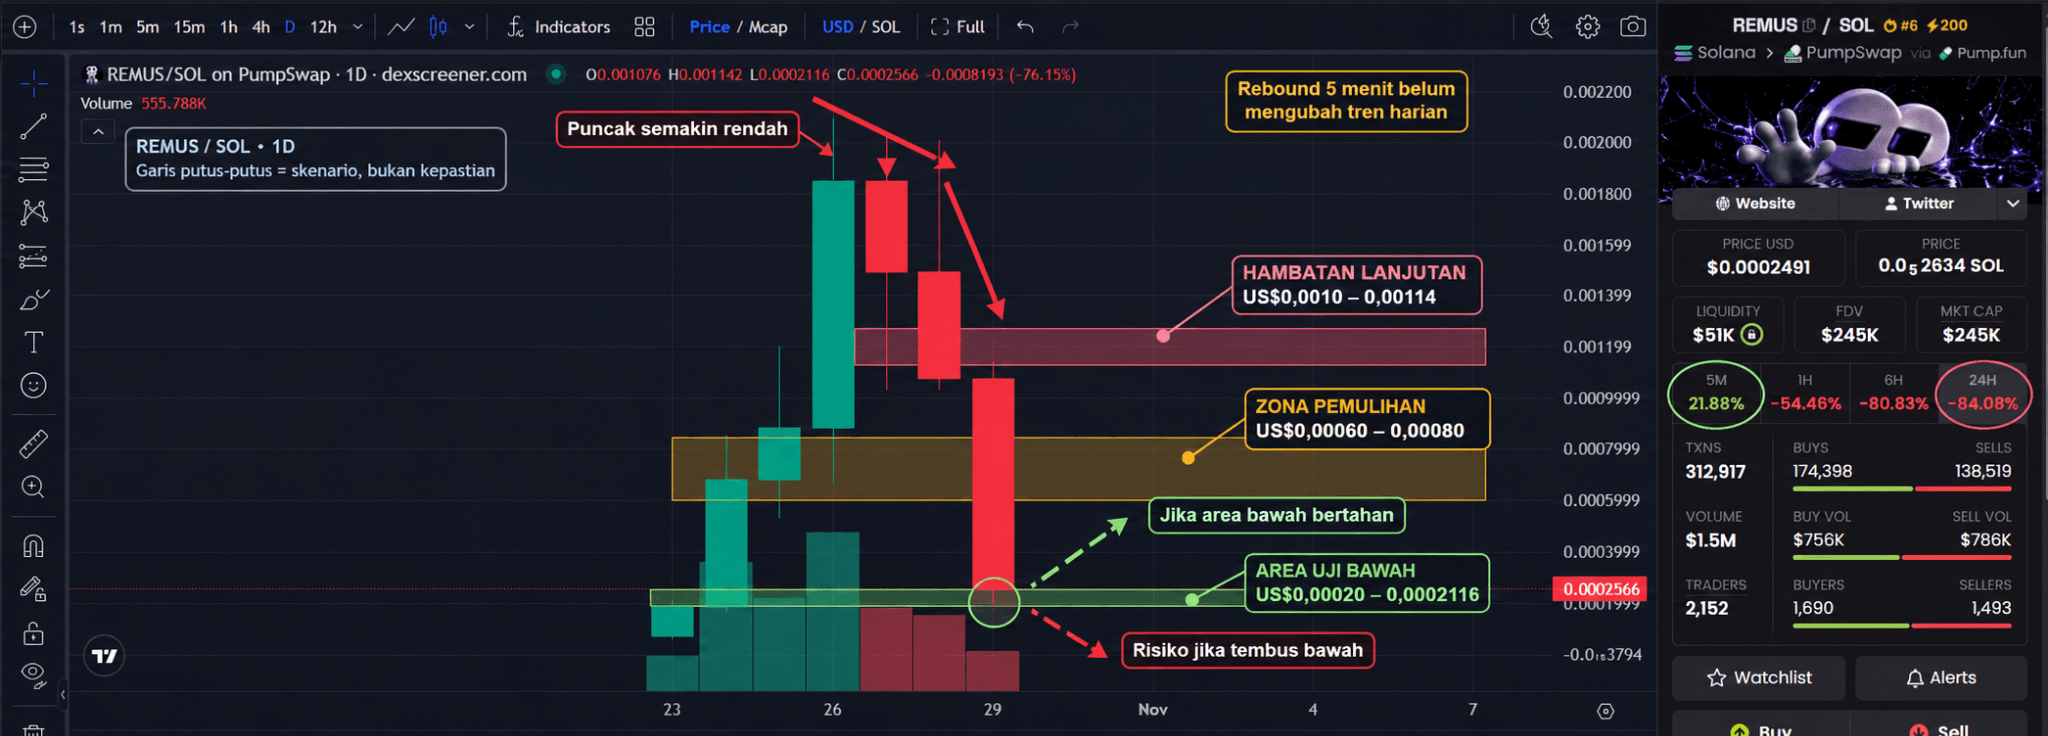
Lower area: US$0.00020–US$0.0002116
US$0.0002116 is the low of the last candle shown in the image. US$0.00020 is a rounded boundary for monitoring price reactions around this level.
If buying repeatedly appears in this area and the price holds, the likelihood of support forming improves. Conversely, a sustained break below it would weaken the recovery scenario.
Recovery zone: US$0.00060–US$0.00080
This range is close to the trading area of the candles before the major spike. After the price fell below it, the zone became worth watching as a possible obstacle during a rebound.
It is quite far from the panel price, so it should not be assumed to be a near-term target. A chart with a smaller interval is needed to identify obstacles between the current price and this zone.
Higher resistance: US$0.0010–US$0.00114
This area includes approximately the opening and high of the last red candle. A recovery toward this range would require a much larger increase and sustained improvement in demand.
Holding above it would improve the visible price structure. However, briefly touching this area would not be enough to declare that an uptrend has returned.
Read also: GIGATENEV Corrects: Is It Still Interesting or Is the Hype Fading?
REMUS Price Prediction Under Three Scenarios
1. The price bounces and begins to recover
This scenario gains support if the lower area holds and the price then forms a higher low. Improving buy value over the same observation period would provide additional evidence.
The US$0.00060–US$0.00080 zone could be the next reference point if the recovery continues. If the price is rejected and falls below the latest low again, this scenario weakens.
2. The price moves sideways after the decline
REMUS could stop falling without immediately posting a large increase. In this situation, buyers and sellers begin to establish a new trading range.
There are not yet enough candles to define the range’s boundaries accurately. Wait for several price tests before calling it stable consolidation.
3. The decline continues to a new low
This risk increases if the price breaks below the lower area and fails to recover above it. Weaker bounces would also indicate that demand is not sufficient to absorb selling.
The available image does not provide a strong basis for determining further targets below US$0.00020. Adding lower figures without supporting historical data would create misleading precision.
Read also: FOTF Price Prediction: Can It Break $1? Check the Calculations
Three Things to Check Before Making a Decision
1. Is liquidity sufficient for your trade size?
The US$1.5 million volume summarizes trading over a period, while US$51,000 in liquidity represents the value of assets in the pool shown. High volume does not mean every transaction can be executed without moving the price.
Check the estimated swap output for the amount you intend to use. The portfolio value shown on screen may differ from the proceeds of a sale after price impact and fees.
2. Are you looking at the correct token?
The name Remus Coin can be confusing if other tokens have similar names. Verify the token address, not just the logo or ticker.
The token address used in this analysis is:
CA8q2mkYWZnUNqYmf6pxyxAPZsmSe2EG9P7hHMW5pump
3. Is your decision driven only by a brief price increase?
A green five-minute figure can easily attract attention after a major decline. Compare it with longer time frames so you do not mistake a brief bounce for a full recovery.
If you want to explore other asset options, you can sign up for Bittime and check the available assets. Make sure an asset is available before planning a transaction.
Conclusion
REMUS remains under downward pressure on the daily chart despite a brief rise. The lower area needs to hold, and the price must then show a gradual recovery before the prospect of a sustained increase becomes more convincing.
Use the levels in this article as monitoring references, not guarantees of price direction. Supplement your assessment with the latest data and educational resources before making a decision.

Bittime is a licensed Digital Financial Asset Trader (PAKD) platform authorized and supervised by the Financial Services Authority (OJK) — where you can buy Bitcoin in Indonesia and hundreds of other crypto assets starting from IDR 10,000. Registration is quick and secure, and you can get started today.
Track the conversion rate of USDT to IDR and your favorite crypto assets’ price movements in real time. Everything is available in one crypto investment app that can be downloaded for free from the Play Store.
Ready to get started? Sign up for Bittime now and put your investment strategy into action with a platform trusted by millions of users in Indonesia.
FAQ
Can the price of Remus Coin rise again?
It remains possible if buying can halt the decline and push the price above the previous bounce high. A five-minute rise alone does not confirm a change in the daily trend.
What is the REMUS price on the chart analyzed?
The market panel shows US$0.0002491, while the C value on the daily candle is US$0.0002566. These figures reflect the screenshot, not the live price when the article is read.
Why did the price fall despite more buy transactions?
The number of transactions does not reflect their total value. In the image, sales worth around US$786,000 exceed purchases worth around US$756,000.
Where are the REMUS support and resistance areas?
The US$0.00020–US$0.0002116 area is a downside test reference. The US$0.00060–US$0.00080 and US$0.0010–US$0.00114 zones may act as recovery resistance, though their strength still needs to be tested.
Does an 84% decline mean REMUS is cheap now?
A large decline only shows the price change relative to a comparison period. Assessing the opportunity still requires examining demand, liquidity, token ownership, and the risk of further declines.
Disclaimer: The views expressed belong exclusively to the author and do not reflect the views of this platform. This platform and its affiliates disclaim any responsibility for the accuracy or suitability of the information provided. It is for informational purposes only and not intended as financial or investment advice.

.png)