Somnia Price Prediction November 2026: Can SOMI Reach US$0.22?
2026-10-29
Somnia price prediction towards November 2026 bucket places US$0.22 as a recovery scenario. SOMI needs to maintain its price improvement and break through the US$0.1933 resistance before that zone becomes the next target.
Prices rising again does not automatically indicate that the downtrend has ended.
This article combines a CoinMarketCap snapshot with analysis and a SOMI/USDT chart dated October 25, 2026, for the discussion.
The goal is to explain the recovery conditions, watch levels, and conditions that could invalidate the bullish scenario.
Key Takeaways
The US$0.22–US$0.221 zone is a conditional target after SOMI is able to pass US$0.1933.
The US$0.1683 level in the initial source was an intraday low, not a confirmed support level.
The November predictions are structured as technical scenarios, not as price certainty or target achievement dates.
SOMI Prices Approaching November: The Context Has Changed
On CoinMarketCap October 29, 2026, the SOMI price was recorded US$0,186594, with a 24-hour trading volume of aroundUS$5.13 millionand market capitalizationUS$53.55 million.
This figure is a snapshot when the page was accessed, not the execution price. real-time.
The latest position numerically is above US$0.179.
Confirmation should be checked on the same chart and trading pair.
Read Also:Convert 1 SOMI to IDR - Somnia to Indonesian Rupiah Exchange Rate
Why are US$0.179 and US$0.1933 so decisive?
In the analysis accompanying the chart, the US$0.179 area is a level that needs to be recaptured after previously being broken below.
A daily close above it would be an early sign of improvement.
Daily candlesticks summarize price movements over a single day; their values may still change before the period ends.
The next level, US$0.1933, acts as resistance, an area that could potentially generate selling pressure. Breaking through it momentarily is different from holding above it.
Therefore, Somnia analysis needs to pay attention to the closing price and market response after the breakout.
As a further interpretation, a successful retest of US$0.1933 could strengthen the recovery scenario.
A retest means the price returns close to the recently broken level to see if buyers are still able to hold it.
This is an observational criterion, not an event that has been confirmed by sources.
Read Also:XTO Price Prediction: Could It Reach $1? Here's the Calculation and the Risks
The US$0.22 SOMI Target Requirement Becomes Relevant
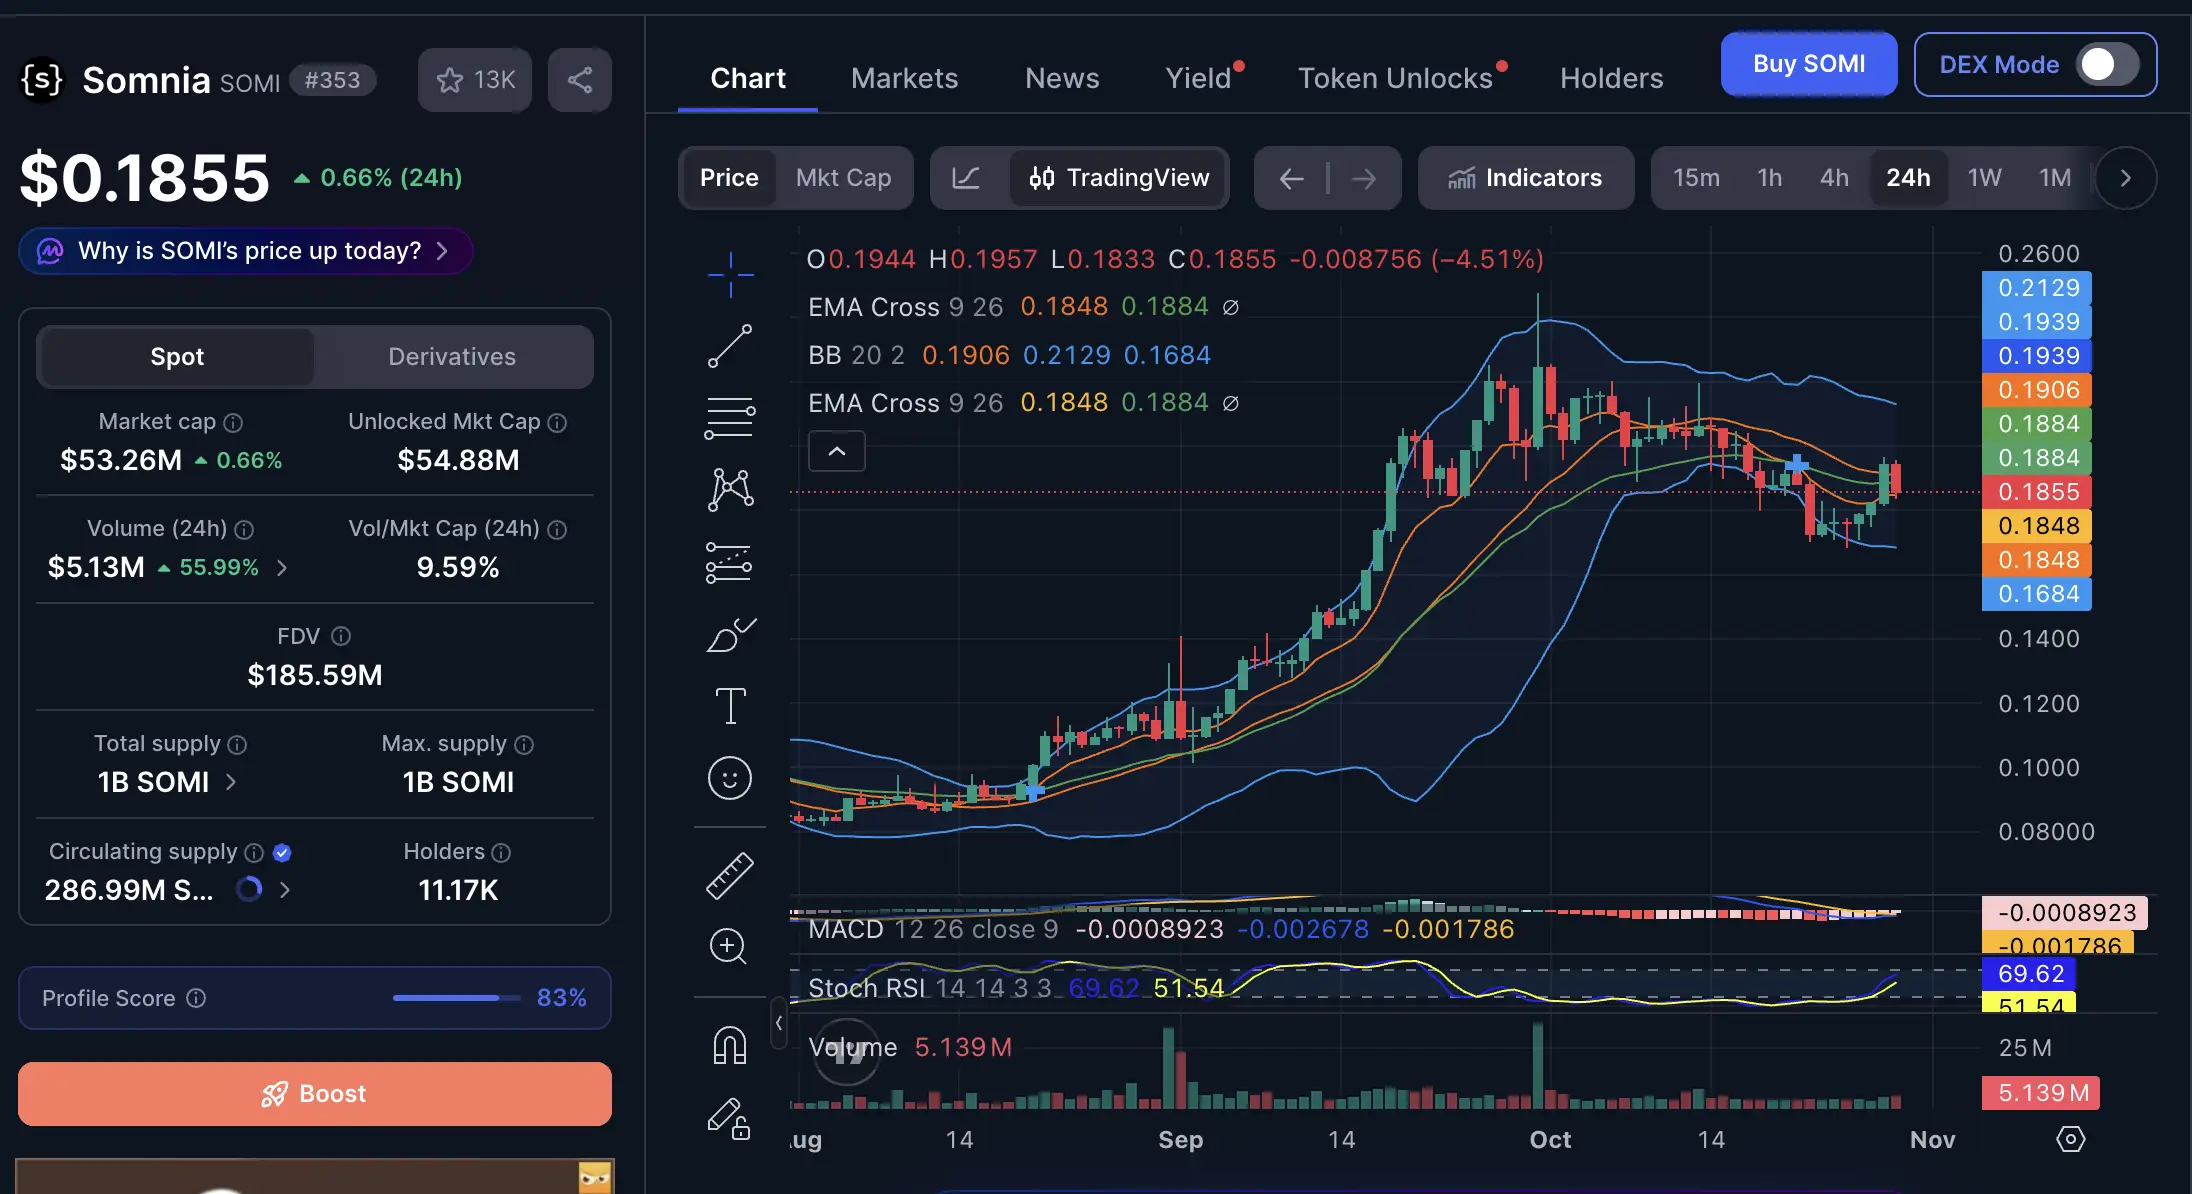
Price SOMI to IDR via Bittime Market
The initial source identified the US$0.221 zone as an area that would become relevant again if US$0.1933 were captured.
The headline uses US$0.22 as a rounding point for ease of reading, while the technical discussion still treats US$0.22–US$0.221 as the zone.
Dari snapshot US$0.186594, an increase towards US$0.22 equivalent to approximately 17,9%.
The figure is a calculation of price distance, not an estimate of the chance of success or profit to be obtained.
For the November 2026 SOMI prediction, the sequence is to maintain the recovery area, break through resistance, then evaluate the response towards the target zone.
The available sources do not provide a probability model or a basis for setting a specific date when the target will be achieved.
Read Also:PREDICT Token Price Prediction 2026: Impact of Futures Listing
SOMI Price Scenario Comparison in November
The following table outlines possible directions based on the levels in the initial source. The flat scenario represents an interpretation of the range between those two levels, not a confirmed new pattern.
This table helps readers adjust their judgments as conditions change.
No scenario should be maintained if the subsequent price movement contradicts its conditions.
Want to have exposure to American stocks?Register at Bittime and start investing through tokenized stocks.
Read the Confirmation Before Making a Decision
The main focus is the quality of recovery, not just the distance to the target.
Candle closing, the ability to maintain levels, and trading activity on the same pair help distinguish sustained improvement from temporary bounces.
CoinMarketCap aggregate volume cannot directly replace Binance candlestick volume. Also, avoid adding conclusions from the RSI or MACD, as these indicators are not available on the source chart.
To keep up with market developments, you can register at Bittime and learn about available services. Check SOMI availability and transaction terms through official channels before purchasing.
Bittime is a licensed and regulated Digital Financial Asset Trader (PAKD) supervised by Indonesia’s Financial Services Authority (OJK) — where you can buy Bitcoin in Indonesia and hundreds of other crypto assets starting from just Rp10,000. The registration process is fast, secure, and you can get started today.
Track USDT to IDR conversions and monitor your favorite crypto assets in real time. Everything is available in one crypto investment app that you can download for free on the Play Store
Ready to start? Register now on Bittime and execute your investment strategy with a platform trusted by millions of users in Indonesia.
FAQ
Can SOMI reach US$0.22 by November 2026?
It could be a technical scenario if the recovery persists and US$0.1933 is surpassed. The timing of this achievement is yet to be determined.
Why is US$0.1933 important?
The source's analysis places it as resistance before the US$0.221 zone becomes relevant again.
Is US$0.1683 a definite support?
No. The figure is the intraday low on October 25th, when the candle was not yet complete.
What happens if recovery fails?
If the lower level is broken without recovery, the US area0,15–US0.154 becomes the next observation zone.
Is this prediction using the November chart?
No. The November scenario is based on the October 25 chart and the October 29, 2026 price snapshot.
Disclaimer: The views expressed belong exclusively to the author and do not reflect the views of this platform. This platform and its affiliates disclaim any responsibility for the accuracy or suitability of the information provided. It is for informational purposes only and not intended as financial or investment advice.

.png)