Radiant Capital (RDNT) Price Prediction 2026-2030: Latest Analysis and Targets
2026-06-18
Radiant Capital (RDNT) price surged 22.87% in the last 24 hours, from a low of $0.000914 to a high of $0.001105.
This surge occurred amidst still bearish market sentiment, with the Fear & Greed Index at 22 (Extreme Fear).
Radiant Capital (RDNT) trading volume reached $3.48 million, or 222% of market capitalization, indicating very high speculative interest.
This article will review the RDNT price prediction for 2026-2030, technical analysis based on the latest data, and support and resistance levels to monitor.
Key Takeaways
RDNT's current price is $0.001105, up 22.87% in 24 hours. It rebounded from a low of $0.000914 to a high of $0.001122.
A market cap of $1.58 million and a volume of $3.48 million (a 222% ratio) indicate significant trader interest.
Technical indicators: 9-day moving average (EMA) at $0.001160 (bearish), 26-day moving average (EMA) at $0.000911 (bullish). MACD is negative, Stochastic RSI is neutral.
Register at Bittime now and start trading crypto with a fast, secure, and easy process in the app.
Current RDNT Price and Market Data
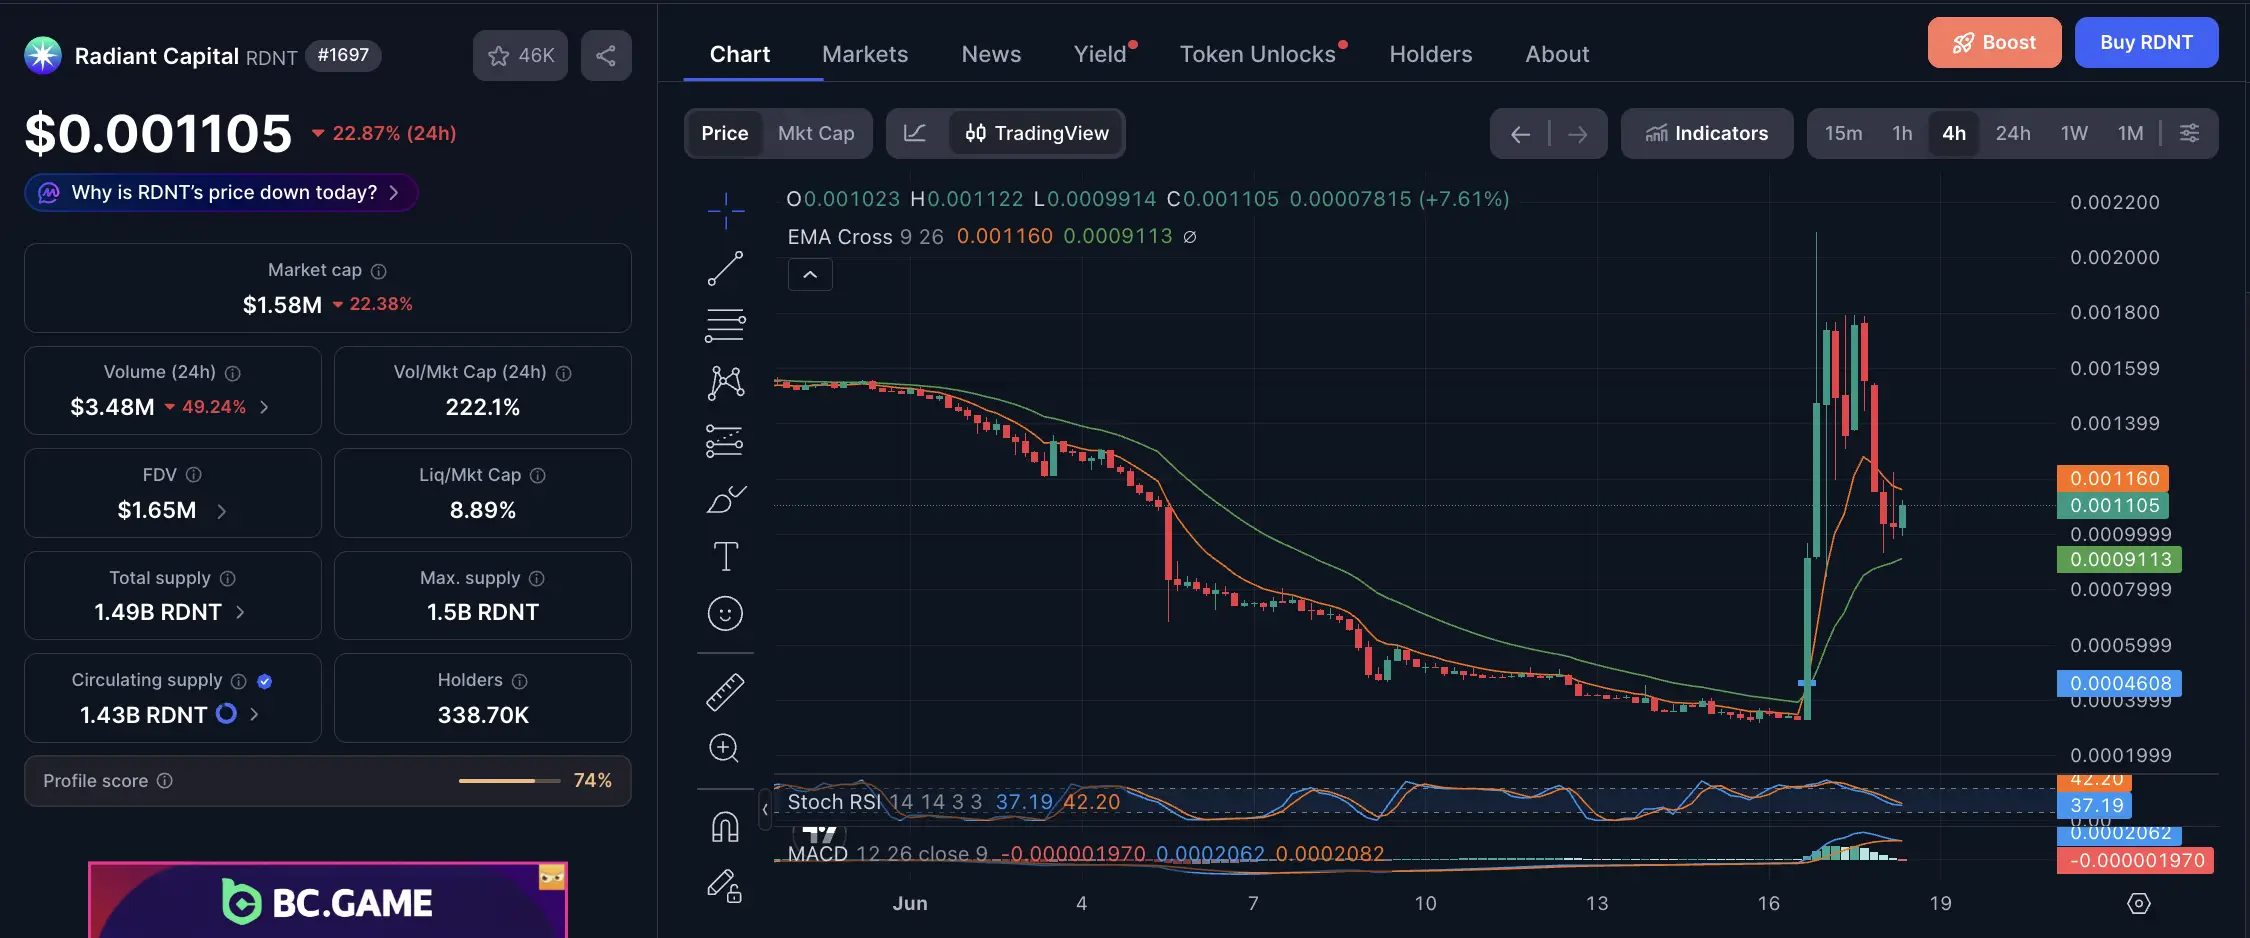
Price: $0,001105
24 hour changes: +22,87%
Open: $0,001023
High 24 jam: $0,001122
Low 24 jam: $0,000914
Market cap:$1.58 million
Volume 24 jam:$3.48 million
Volume/Market Cap Ratio:222.1% (very high)
FDV:$1.65 million
Total supply:1.49 billion RDNT
Max supply: 1.5 billion RDNT
Circulating supply:1.43 billion RDNT
Holders: 338.700
RDNT rebounded sharply by 22.87% from a low of $0.000914. Volume of $3.48 million with a market cap of just $1.58 million indicates intense trading activity.
Read also:AMP Price Prediction 2026-2030: Is AMP Coin a Good Investment?
RDNT Technical Analysis
EMA Cross 9,26:
MOTHER 9:$0.001160 (price below, short-term bearish)
MOTHER 26:$0.000911 (price above, bullish)
Stoch RSI (14):42.20 / 37.19 (neutral, not overbought/oversold)
MACD (12,26, close9):
MACD line: -0,00000197
Signal line: 0,0002062
Histogram: -0.0002082 (negative, bearish momentum still exists)
Key level
Nearest resistance: $0,001122 (high 24 jam)
Next resistance:$0.001160 (EMA 9)
Support: $0,000914 (low 24 jam)
Read also: Portal Coin (PORTAL) Price Prediction 2026-2030: Is It a Good Investment?
RDNT Price Prediction 2026
Based on CoinCodex and the latest data:
Short term targets (1-5 days):
After a 22.87% rebound, a short-term correction is likely. If $0.001122 is broken, the next target is $0.001160 (9-day EMA). If this fails, a retest of $0.000914 is likely.
End target 2026:$0.000978 (CoinCodex projection)
2026 range: $0,0007 - $0,0127
A volume of $3.48 million (222% of the market cap) indicates high speculative interest. This could lead to extreme volatility in both directions.
Read also: SPCXx Price Prediction: Can SpaceX Stock Token Hit $250?
RDNT Price Prediction 2027-2030
RDNT Price Prediction 2027
Range$0,0006 - $0,0030
Potential peak in March-April 2027 with a 273% increase from current levels
RDNT Price Prediction 2028
Consolidation $0,0008 - $0,0015
Moderate increase target of 25-75%
RDNT Price Prediction 2029
Recovery to$0,0015 - $0,0020
Acceleration in the second half of the year
RDNT Price Prediction 2030
Bullish projection$0,0025 - $0,0050
Potential increase of up to 576% from 2026 levels in an optimistic scenario
Read also: Uniswap (UNI) Price Prediction 2030: $100 from Standard Chartered
Level Support dan Resistance RDNT
Support:
S1: $0,000914 (low 24 jam)
S2: $0,000730 (pivot)
S3: $0,000425 (pivot)
Resistance:
R1: $0,001122 (high 24 jam)
R2:$0.001160 (EMA 9)
R3: $0,001544 (pivot)
A breakout above $0.001160 would confirm a short-term bullish trend. Failure above $0.001122 could lead to a retest of $0.000914.
New to crypto investing? Bitcoin (BTC) and Ethereum (ETH) are among the most popular starter cryptocurrencies to explore and trade on Bittime.
RDNT Bearish Sentiment and Extreme Fear
Fear & Greed Index di 22 (Extreme Fear) — a level that has historically often been a sign of a bottom forming.
RDNT's bearish sentiment remains dominant in the long term, but the 22.87% rebound indicates buying action at low levels.
High volatility:A volume of $3.48 million with a market cap of $1.58 million (222% ratio) means price movements can be extreme in both directions.
Conclusion
The 2026 RDNT price prediction shows a range of $0.0007–$0.0127, with a year-end target of $0.000978. The current price is $0.001105, after rebounding 22.87% from a low of $0.000914.
RDNT short-term price targets: $0.001122 (24-hour high) and $0.001160 (9-day moving average). Key support is at $0.000914.
Volume of $3.48 million, a 222% market cap ratio, indicates high trader interest. This could fuel further gains, but also increases the risk of a sharp correction.
Radiant Capital's 2027-2030 forecast shows potential for a gradual recovery, with a bullish scenario reaching a 576% increase by 2030.

Let’s start trading crypto with the largest assets, such as BTC/IDR and ETH/IDR, right in the Bittime app.
Bittime is a licensed and regulated Digital Financial Asset Trader (PAKD) supervised by Indonesia’s Financial Services Authority (OJK) — where you can buy Bitcoin in Indonesia and hundreds of other crypto assets starting from just Rp10,000. The registration process is fast, secure, and you can get started today.
Track USDT to IDR conversions and monitor your favorite crypto assets in real time. Everything is available in one crypto investment app that you can download for free on the Play Store
Ready to start? Register now on Bittime and execute your investment strategy with a platform trusted by millions of users in Indonesia.
FAQ
How much does RDNT cost today?
$0.001105, up 22.87% in 24 hours. High $0.001122, low $0.000914.
What is the RDNT price prediction for 2026?
Range $0.0007 - $0.0127, with a year-end target of $0.000978.
What are the support and resistance levels of RDNT?
Support: $0,000914, $0,000730, $0,000425. Resistance: $0,001122, $0,001160, $0,001544.
What does the RDNT technical indicator say?
The 9-day moving average (EMA) is at $0.001160 (bearish), and the 26-day moving average (EMA) is at $0.000911 (bullish). The MACD is negative, and the Stochastic RSI is neutral.
Why is the RDNT volume so high?
A volume of $3.48 million with a market cap of $1.58 million (222% ratio) indicates very high speculative interest.
Disclaimer: The views expressed belong exclusively to the author and do not reflect the views of this platform. This platform and its affiliates disclaim any responsibility for the accuracy or suitability of the information provided. It is for informational purposes only and not intended as financial or investment advice.

.png)