BUILDon (B) Price Prediction 2026: Why Is B Coin Rising?
2026-11-05
The BUILDon (B) price forecast is attracting renewed attention as the token attempts to recover from selling pressure that began in September. On the November 5, 2026 daily chart, B coin was trading at $0.1314, slightly above its 20-day moving average. However, the latest candle still recorded a 1.61% decline, indicating that buyers have yet to gain full control.
So why did BUILDon's price rise, and can its recovery continue? Beyond meme coin sentiment and developments in the USD1 ecosystem, the chart shows price movements narrowing around $0.13. A rebound is possible, but the price still needs to break through key resistance before an upward trend can be considered more convincing.
Key Takeaways
- BUILDon is trading around $0.1314 and beginning to consolidate after declining throughout October.
- Trading activity, BNB Chain sentiment, and developments in the USD1 ecosystem are important factors to watch.
- The nearest resistance is at $0.1397, while the $0.1207 area is an important support level if selling pressure increases again.
BUILDon (B) Price Today: Starting to Stabilize at $0.13
BUILDon (B) was trading around $0.13 on November 5, 2026, with a market capitalization of approximately $131 million and a circulating supply of 1 billion tokens.
Its 24-hour trading volume was approximately $4.2 million. This activity indicates that B coin remains actively traded, although it is not enough to confirm a trend reversal.
Based on the daily chart analyzed, the price briefly traded above $0.20 in September before declining again throughout October.
As November began, price action appeared calmer. Daily candles began clustering within a narrow range around $0.13, contrasting with the sharp volatility seen in previous months.
One detail is worth noting. Price aggregators may show gains over the previous 24 hours even when the daily candle on the chart closes in the red.
This difference arises because the calculation periods are not necessarily the same. Therefore, a daily gain does not automatically mean the price trend has turned bullish.
Read also: WWAR Price Prediction: Can World War Asset Reserve Reach $0.10?
Why Is BUILDon's Price Rising?
BUILDon's recovery cannot yet be attributed to one definitive cause.
So far, there is insufficient evidence that the latest increase resulted from major investor purchases or a particular announcement. However, the following three factors provide context for understanding B coin's price movements.
1. The Price Is Beginning to Find Equilibrium
After several weeks of pressure, BUILDon began moving sideways in late October.
This suggests that the previous decline was no longer as aggressive as it had been in September.
When a price stops making sharp declines, some traders typically begin looking for a potential rebound.
However, sideways movement can also mean that the market is waiting for a new direction. Without a clear increase in volume, price stabilization alone is not enough to signal a trend reversal.
On the latest chart, BUILDon still faces resistance above its current price. This means there is potential for an increase, but it has not yet received strong technical confirmation.
2. Developments in the USD1 Ecosystem Attract Attention
BUILDon is a BNB Chain project developing activities and services around the USD1 stablecoin.
USD1 is associated with World Liberty Financial, while BUILDon uses the B token as a separate asset.
The project initially gained recognition as a meme coin, then began introducing services supporting the use of USD1 across different networks.
One example is B Purchases, a tool designed to simplify cross-chain token purchases.
BUILDon has also outlined plans to develop additional services to expand activity within its ecosystem.
These developments may help sustain community interest in the project. Nevertheless, increased use of USD1 does not necessarily create new demand for the B token.
The relationship between the products, user activity, and economic benefits for token holders remains something that needs to be examined.
3. Meme Coin Sentiment Still Matters
BUILDon retains characteristics of a meme coin, making its price sensitive to community attention and changes in trader interest.
When the market begins to favor riskier assets again, tokens such as B can rise over a short period.
However, the strength of that sentiment is difficult to measure from price alone.
Trading volume can help gauge market activity, but it does not directly show whether buying outweighs selling.
The chart you provided does not yet show an exceptional surge in volume during the latest consolidation phase.
Therefore, the recent increase is better viewed as an attempted recovery rather than proof that strong demand has returned.
Read also: Can XTX Reach US$0.10?
What Is BUILDon (B)?
BUILDon is a cryptocurrency project on BNB Smart Chain that uses the symbol B.
The project is known for its lion-mascot-themed community identity, and later shifted its focus toward the use of the USD1 stablecoin and blockchain services.
BUILDon has also introduced plans to develop technologies related to AI and crypto infrastructure.
Despite its various initiatives, the value of the B token is still influenced by trading activity, market conditions, and user confidence in the project's development.
The B token is also different from both WLFI and USD1.
USD1 is a stablecoin, WLFI is World Liberty Financial's governance token, while BUILDon is a separate asset with its own market and tokenomics.
BUILDon's contract address on BNB Chain is:
0x6bdcce4a559076e37755a78ce0c06214e59e4444
Using the full name BUILDon is important because the ticker B can also refer to other crypto assets.
BUILDon Technical Analysis: Latest Support and Resistance Levels
The daily chart shows that BUILDon experienced substantial rallies in July and September 2026.
However, after the September peak, the price began forming progressively lower highs. This pattern shows that sellers have retained influence over the trend in recent months.
By late October, the decline began to slow, and the price moved within a narrower range.
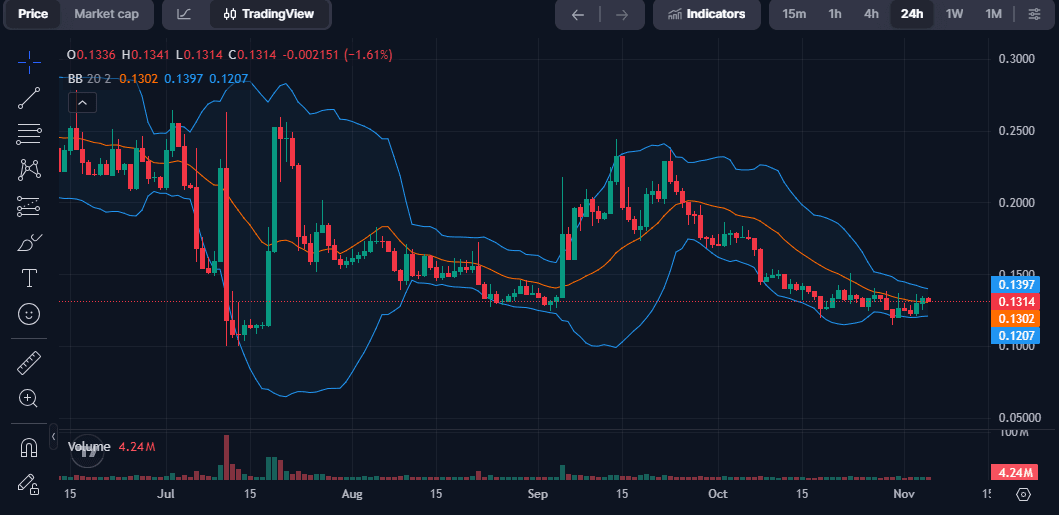
To assess the latest conditions, the Bollinger Bands indicator provides three relevant levels.
Bollinger Bands Indicate Narrowing Volatility
The Bollinger Bands (20, 2) indicator on the chart shows:
- Upper Band: $0.1397
- Middle Band: $0.1302
- Lower Band: $0.1207
The closing price of $0.1314 was slightly above the middle band.
This position indicates that BUILDon is trading near its 20-period average, rather than approaching the upper band, which often draws attention when momentum strengthens.
The Bollinger Bands also appear narrower than during the price spikes in July and September.
This narrowing suggests that volatility is easing. However, the indicator cannot determine whether the next major move will be upward or downward.
Support and Resistance Levels to Watch
The $0.1302 area is the nearest equilibrium point because it coincides with the Bollinger Bands' middle line.
As long as the price remains above this area, another test of resistance remains possible.
On the upside, $0.1397 is the first resistance level that needs to be broken. This level is near the upper Bollinger Band and a price range tested several times in late October.
If the price successfully breaks above that area, attention may turn to $0.15 as the next resistance level based on the previous chart structure.
Meanwhile, $0.1207 is an important support level because it is near the lower Bollinger Band.
A drop below this area would weaken the consolidation structure formed over the past several sessions.
Read also: HYPE Surges After ICE and Trade[XYZ] Bring Hyperliquid Perpetual Futures to the US
BUILDon (B) Price Prediction: Three Possible Scenarios
Based on the daily chart, BUILDon is at a potentially decisive stage.
The price has not yet broken out, but it is also no longer experiencing the sharp declines seen earlier.
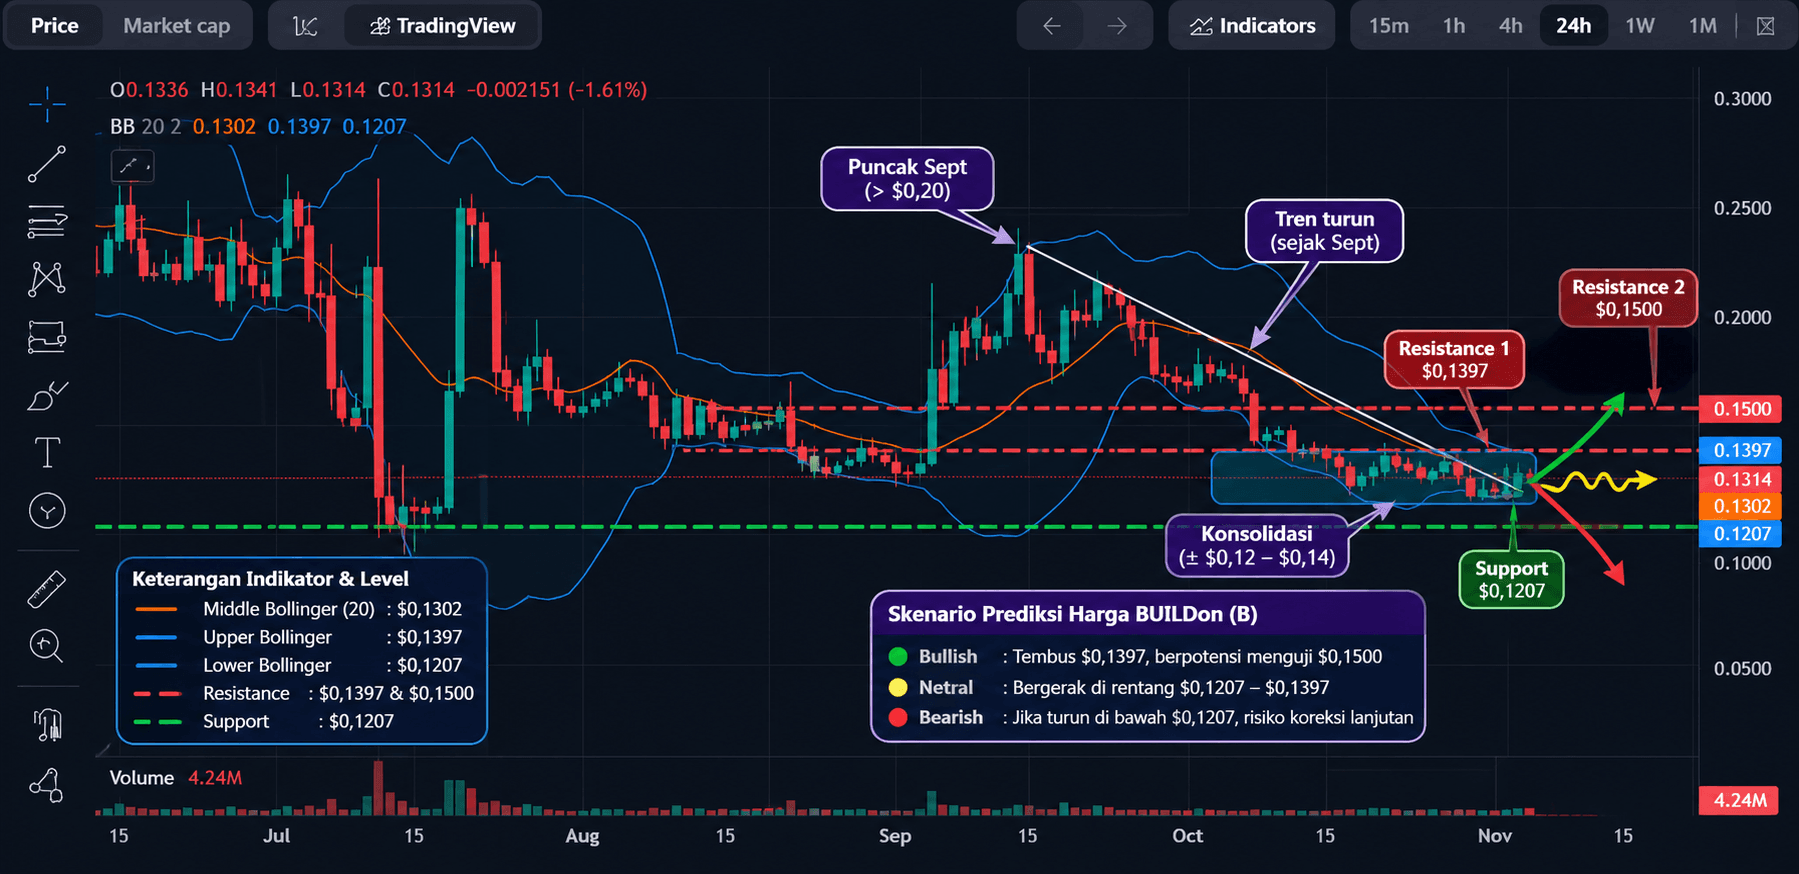
Three possible scenarios can help interpret its next price moves.
Bullish Scenario: BUILDon Could Move Toward $0.15
The bullish case would strengthen if BUILDon breaks above $0.1397 and manages to hold above that level.
Under those conditions, $0.15 would become the next area to test.
From the reference price of $0.1314, a move to $0.15 would represent an increase of about 14%.
However, that figure only illustrates the distance to resistance, not a guaranteed price target.
For stronger confirmation of the bullish scenario, the increase should be accompanied by higher trading activity and a candle close above resistance.
Without such confirmation, the price could return to its consolidation range.
Neutral Scenario: Price Holds Around $0.13
If neither buyers nor sellers establish clear dominance, BUILDon may continue moving sideways.
This can happen when the market is waiting for new project developments or shifts in overall crypto sentiment.
As long as the price remains within its consolidation range, daily increases and decreases do not necessarily provide a strong trend signal.
Such a phase is better understood as a period in which the market is determining its next direction.
Bearish Scenario: Risk of Another Correction Increases
The bearish scenario would gain strength if the price loses its equilibrium area and moves toward lower support.
If selling pressure becomes strong enough to break below $0.1207, the consolidation structure may weaken.
In that situation, traders should refocus on price zones that previously saw trading activity during the earlier decline.
Rising volume during a price decline may signal renewed selling pressure.
All three scenarios are conditional. Changes in volume, market sentiment, or project-related information can alter the price direction at any time.
Read also: USOR vs. USDF: Which Is More Attractive to Buy? Five Factors to Consider
Can BUILDon Return to Its All-Time High?
BUILDon previously reached an all-time high of around $0.76.
Compared with its $0.1314 position on the chart, the current price is still approximately 83% below that peak.
This means a recovery to the previous record would require a much larger gain than a short-term rebound toward $0.15.
This distinction matters because a price reached in the past is not automatically a target that will be reached again.
BUILDon would need strong, sustained market demand to approach its previous high.
Liquidity, product adoption, and BNB Chain market conditions could influence that process.
For now, the chart offers stronger support for discussing the possibility of a short-term rebound than for assuming an imminent return to the all-time high.
Risks of Buying B Coin After a Price Increase
BUILDon remains a speculative asset whose risks warrant attention, particularly after the large price swings seen over recent months.
The first risk is buying before a rebound has been confirmed. A price that appears to be stabilizing may fall again if buyers fail to sustain momentum.
The second risk comes from meme coin sentiment. Community attention can shift quickly, and a project's popularity does not necessarily translate into sustained demand for its token.
The third risk concerns product development. The development of USD1 and AI services could be positive for the project, but any direct benefit to the price of B has yet to be demonstrated.
The fourth risk is market volatility. Changes in Bitcoin and BNB market conditions, as well as leveraged activity in derivatives markets, can affect BUILDon's price movements.
These factors mean price predictions should be read as analyses of possible outcomes, not as guarantees of investment returns.
Read also: REMUS Price Prediction: Down 84%—Could It Rebound or Fall Further?
Five Things BUILDon Investors Should Monitor
Before concluding that the uptrend has returned, five indicators are worth watching:
- Daily candle closes, to assess whether the price can sustain gains after testing resistance.
- Trading volume, to evaluate whether market activity increases alongside price changes.
- Bollinger Bands patterns, particularly when volatility begins to expand after a period of consolidation.
- USD1 ecosystem activity, including product developments and adoption.
- BNB Chain market sentiment, because B's price movements are also affected by broader crypto market conditions.
Considering these indicators together is more useful than relying on a single green candle.
If you want to follow developments in the Bitcoin, BNB, and other altcoin markets, you can register with Bittime to read the latest crypto news and monitor market information as part of your research.
Conclusion
The current BUILDon (B) price outlook suggests a potential rebound after the token came under pressure beginning in September 2026. The daily chart shows a consolidation phase, with the price starting to stabilize around $0.13.
A more convincing rally would require a breakout above resistance, while a decline below support could increase the risk of another correction. Developments involving USD1 and BNB Chain remain relevant, but the price direction will depend on how the market responds.
To assess B coin's prospects, the main focus should remain on price movements, trading volume, and verifiable project developments.

Bittime is a licensed Digital Financial Asset Trader (PAKD) regulated and supervised by Indonesia's Financial Services Authority (OJK) — where you can buy Bitcoin in Indonesia and hundreds of other cryptocurrencies starting from IDR 10,000. Registration is fast and secure, and you can get started today.
Track the conversion of USDT to IDR and the price movements of your favorite cryptocurrencies in real time. Everything is available in one crypto investment app that you can download for free from the Play Store.
Ready to get started? Sign up for Bittime now and put your investment strategy into action on a platform trusted by millions of users in Indonesia.
FAQ
Why Is BUILDon (B) Rising Today?
BUILDon's increase over the observed 24-hour period may be related to changes in trading activity, meme coin sentiment, and interest in the USD1 ecosystem. However, no single factor has been proven to be the sole cause of the latest increase. The daily chart still shows consolidation following the previous decline.
What Is B Coin's Current Price?
On the November 5, 2026 chart used as a reference, BUILDon closed at approximately $0.1314. Market data from the same period also showed a price around $0.13. The latest price may change with trading activity.
Can BUILDon Rise Again in 2026?
Further gains remain possible if BUILDon breaks above the $0.1397 resistance level on stronger volume. Based on the chart structure, the $0.15 area could become the next level to test. However, there is no guarantee that a breakout will occur or hold.
How Is BUILDon Connected to USD1 and WLFI?
BUILDon is a BNB Chain project developing services around the USD1 stablecoin. That stablecoin is associated with World Liberty Financial, while the B token is a separate asset from both WLFI and USD1. Ecosystem developments may influence sentiment, but they do not guarantee a rise in BUILDon's price.
What Are the Risks of Buying BUILDon After a Price Increase?
The main risks include price corrections, failed breakouts, and shifts in meme coin sentiment. The token's movements are also influenced by market conditions and the project's ability to develop its products. Therefore, a short-term price increase is not enough to confirm a bullish trend.
Disclaimer: The views expressed belong exclusively to the author and do not reflect the views of this platform. This platform and its affiliates disclaim any responsibility for the accuracy or suitability of the information provided. It is for informational purposes only and not intended as financial or investment advice.

.png)