Bitcoin Price Prediction February 23, 2026: Consolidation Phase
2026-02-22
Based on current market data, Bitcoin (BTC) is navigating a tight range that demands close observation from both day traders and long-term investors. Understanding the BTC price prediction for February 23, 2026, is essential for anyone looking to capitalize on potential volatility spikes in the BTC/USDT pair.
Currently, Bitcoin is trading at approximately 67,984.01 USDT, reflecting a modest 24-hour change of +0.39%. While the immediate price action appears relatively stable, underlying technical indicators on the 4-hour chart suggest the market is coiling for its next significant move.
This phase of low volatility often acts as a precursor to a decisive trend breakout, making today's price levels critical for setting upcoming trade strategies.
Key Takeaways
- Bitcoin (BTC/USDT) is currently in a consolidation phase, trading near the 67,984.01 USDT mark with low 24-hour volatility.
- Technical indicators like Bollinger Bands confirm a "squeeze" effect, signaling an imminent increase in price volatility.
- Vital price levels for today include a primary resistance at 68,768.21 USDT and a key support floor at 66,398.66 USDT.
Bollinger Bands: The Squeeze Signal
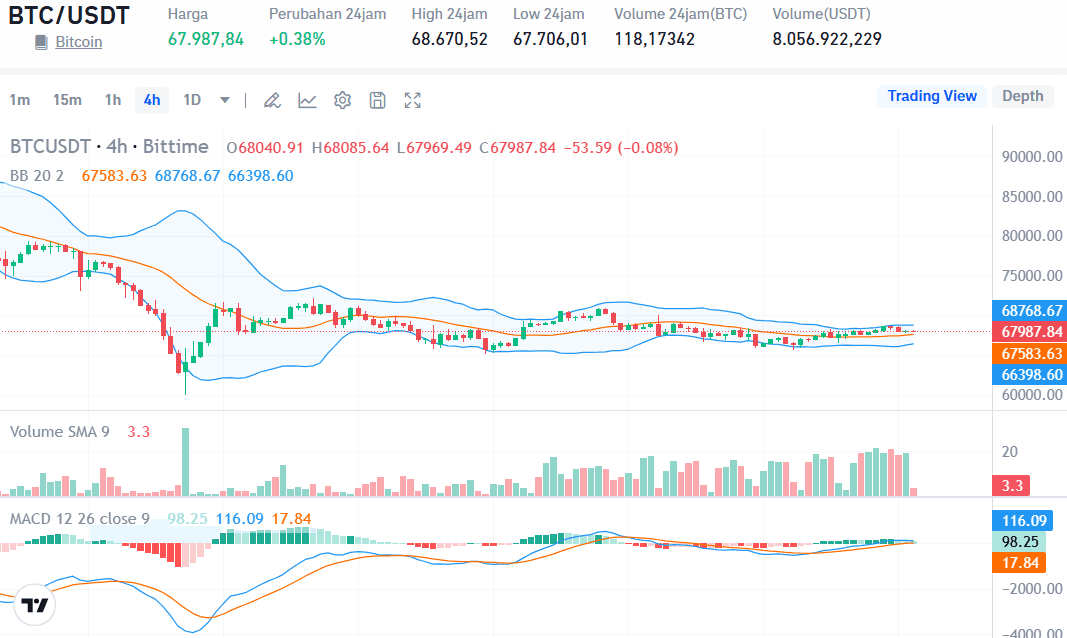
A detailed look at the 4-hour BTC/USDT chart reveals a classic Bollinger Band squeeze. The upper and lower bands are tightening toward the median, which indicates that market volatility has reached a temporary floor.
Historically, when the bands constrict this significantly, it suggests that market participants are indecisive, awaiting a fundamental catalyst to drive the next major trend.
The price is currently positioned slightly above the 20-period Middle Band (67,583.44 USDT), which serves as the immediate pivot point. As long as BTC maintains its position above this middle line, the short-term bias remains cautiously bullish.
However, traders should be prepared for a rapid expansion of these bands, which could propel the price toward the upper resistance or force a sharp retracement toward lower support levels.
MACD and Volume Momentum
The Moving Average Convergence Divergence (MACD) indicator currently supports a neutral to slightly bullish outlook. The MACD line (115.79) remains above the signal line (17.78), and both are trending in positive territory.
While the histogram shows green bars, their diminishing height confirms that while some buying pressure exists, it lacks the aggressive volume needed for a vertical breakout.
Trading volume reflects this sentiment, staying relatively low at an SMA 9 level of 3. Without a significant influx of liquidity, Bitcoin may continue to oscillate within its current narrow boundaries.
For a true trend continuation to occur on February 23, a visible spike in volume bars is required to confirm that institutional or large-scale buyers are re-entering the market at these levels.

Support and Resistance Mapping for BTC/USDT
For those planning trades for February 23, 2026, mapping out these specific price levels is vital for effective risk management:
- Resistance 1 (Immediate Target): 68,768.21 USDT. This level aligns with the Upper Bollinger Band. A clean break above this with high volume could open the doors for a rally toward the 68,670.52 USDT high and beyond.
- Support 1 (Immediate Floor): 67,583.44 USDT. This is the Middle Band and the primary short-term cushion. Losing this level would signal a shift back to a bearish intraday bias.
- Support 2 (Final Defense): 66,398.66 USDT. This represents the Lower Bollinger Band. If the price reaches this zone, expect significant buying interest as it indicates an "oversold" condition within the current consolidation range.
Conclusion
The outlook for Bitcoin (BTC/USDT) on February 23, 2026, points toward continued sideways movement with a slight upward tilt, provided the 67,583.44 USDT support holds. The market is effectively coiling; the longer it remains in this narrow range, the more explosive the eventual breakout is likely to be.
Patience is the optimal strategy—wait for a confirmed close above the 68,768.21 USDT resistance or below the 66,398.66 USDT support before committing to a heavy position.
FAQ
What does the Bollinger Band squeeze indicate for BTC/USDT?
A squeeze indicates low volatility and market indecision. It is widely used by traders to predict an upcoming period of high volatility and a potential trend breakout.
Is the current MACD signal strong?
No, the MACD signal is currently considered weak bullish. While the lines are in positive territory, the short histogram bars suggest a lack of strong, sustained buying momentum.
Where should I set my Stop Loss for tomorrow?
Based on the current chart, a conservative stop loss would be slightly below the Lower Bollinger Band at 66,398.66 USDT to protect against a downside breakout.
Why is trading volume so low right now?
Low volume typically occurs during consolidation phases as traders wait for a clear signal or external news event. The current 24-hour volume for this pair is holding at approximately 118.03579 BTC.
What are the current 24-hour high and low for BTC/USDT?
The 24-hour high is 68,670.52 USDT, and the 24-hour low is 67,706.01 USDT.
What is the role of the Middle Bollinger Band in this analysis?
The Middle Band (67,583.44 USDT) acts as a dynamic pivot point. Trading above it suggests a bullish bias, while trading below it indicates bearish pressure within the consolidation range.
How do I use the Daily High for my strategy?
The daily high of 68,670.52 USDT serves as a secondary resistance. A break above this level often signals that the bulls are regaining full control of the market trend.
How to Buy Crypto on Bittime?

Want to trade sell buy Bitcoins and crypto investment easily? Bittime is here to help! As an Indonesian crypto exchange officially registered with Bappebti, Bittime ensures every transaction is safe and fast.
Start with registration and identity verification, then make a minimum deposit of IDR 10,000. After that, you can immediately buy your favorite digital assets!
Check the exchange rate BTC to IDR, ETH to IDR, SOL to IDR and other crypto assets to find out today's crypto market trends in real-time on Bittime.
Also, visit the Bittime Blog for interesting updates and educational information about the crypto world. Find reliable articles about Web3, blockchain technology, and digital asset investment tips designed to enrich your crypto knowledge.
Disclaimer: The views expressed belong exclusively to the author and do not reflect the views of this platform. This platform and its affiliates disclaim any responsibility for the accuracy or suitability of the information provided. It is for informational purposes only and not intended as financial or investment advice.

.png)