Bitcoin Price Prediction for February 22, 2026
2026-02-21
Bitcoin's price action on the Bittime exchange is currently flashing signs of a significant volatility squeeze as the market enters the final weekend of February. As of right now, the btc price today is hovering around $67,691.83, marking a modest 24-hour gain of 0.60%.
While the percentage move is small, the underlying technical structure suggests that the market is coiled like a spring. Traders looking for a bitcoin price prediction (BTC) February 22, 2026, are paying close attention to the 4-hour chart, where a clear consolidation pattern has emerged after a period of downward pressure earlier in the month.
The current trading environment is characterized by a low-volume stability that often precedes a breakout. With a 24-hour trading volume of over 5.1 billion USDT, there is clearly enough liquidity to support a move in either direction.
However, the lack of immediate directionality indicates that both bulls and bears are waiting for a definitive catalyst. This quiet period is essential for price discovery, allowing the market to build a base before attempting to reclaim the $68,000 level or testing deeper support zones.
Key Takeaways
- Bitcoin is experiencing a period of low volatility with prices currently anchored around the $67,691 mark, supported by a positive MACD crossover.
- The Bollinger Bands are tightening significantly, indicating that a sharp price expansion is likely within the next 24 to 48 hours.
- Critical resistance sits at $68,357, while the primary support level to watch for the weekend is $66,210.
Bollinger Bands Analysis: The Imminent Breakout
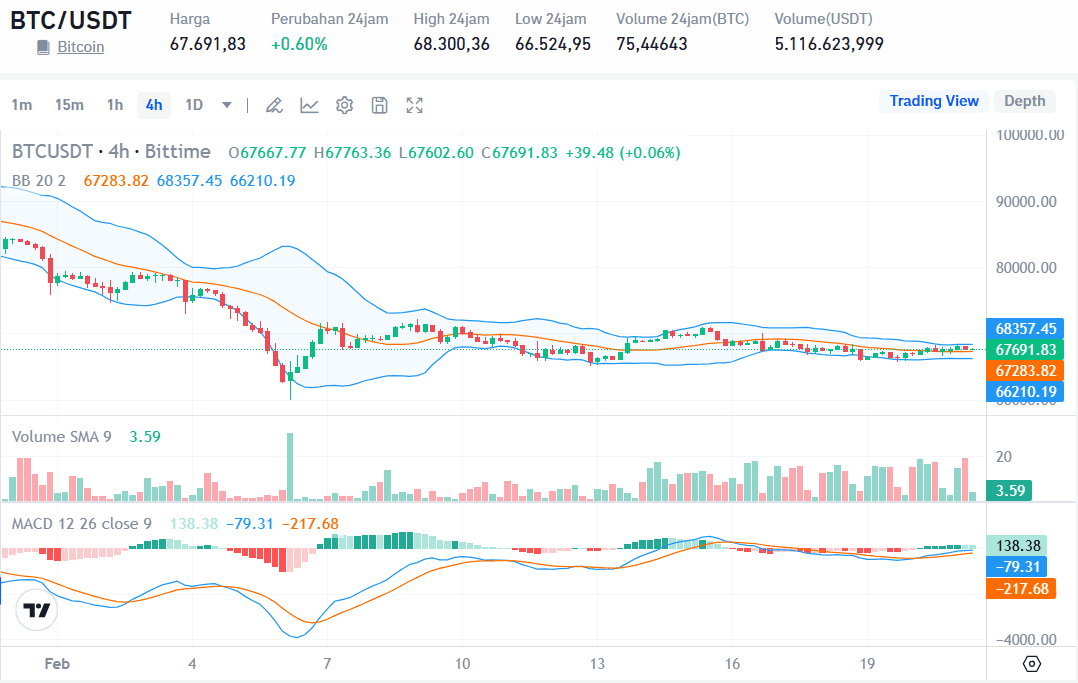
The 4-hour BTC/USDT chart reveals a classic Bollinger Band "squeeze". The upper band is currently positioned at $68,357.45, while the lower band has moved up to $66,210.19.
When these bands contract as they are doing now, it suggests that the market’s standard deviation is shrinking. Historical data shows that such tight ranges rarely last long; they are almost always followed by a high-momentum move that sets the trend for the coming days.
Currently, Bitcoin is trading slightly above the 20-period basis line (the middle orange line) at $67,283.82. Staying above this median is a positive short-term signal, as it suggests that buyers are successfully defending the average price.
If Bitcoin can maintain its position above this basis throughout the night, the probability of an upward break toward the upper band increases. Conversely, a drop below $67,283 would likely see a quick retest of the lower support at $66,210.
MACD Momentum: Shifting Toward the Bulls
The Moving Average Convergence Divergence (MACD) indicator provides an encouraging outlook for those anticipating a price increase. The MACD line (-79.31) has crossed above the signal line (-217.68), resulting in a positive histogram reading of 138.38.
This "golden cross" in the negative territory often signals that the bearish momentum has exhausted itself and a relief rally or trend reversal is in the early stages of formation.
While the MACD is showing a bullish tilt, the histogram bars remain relatively short. This implies that while the direction is shifting upward, the strength of the move is still developing.
For a confirmed bullish run on February 22, we would need to see the MACD line move closer to the zero threshold and the histogram bars grow in height. This would indicate that the current buying pressure is not just a minor bounce but a sustained effort to push the price into a higher trading range.
Support and Resistance Levels to Watch
Identifying the boundaries of the current range is vital for any bitcoin price prediction (BTC) February 22, 2026. On the upside, the 24-hour high of $68,300.36 serves as the immediate psychological and technical hurdle.
A daily close above this level would likely trigger a wave of buy orders, potentially pushing the price toward the next major resistance at $70,000. The closeness of the upper Bollinger Band to this high adds extra weight to this resistance zone.
On the flip side, the 24-hour low of $66,524.95 provides a clear safety net for investors. Below that, the lower Bollinger Band at $66,210.19 acts as the ultimate line in the sand for the current bullish structure.
If Bitcoin were to lose this support, it would invalidate the current consolidation pattern and likely lead to a deeper correction. Fortunately, the volume SMA 9 is currently at 3.59, showing that there is no massive sell-off occurring at these levels.
Global Market Context in 2026
By early 2026, Bitcoin has solidified its role as a cornerstone of the global digital economy. The market is no longer driven purely by retail speculation but is heavily influenced by institutional flows and macroeconomic data.
Factors such as global liquidity cycles and the adoption of Bitcoin by sovereign entities have created a more resilient price floor compared to previous years. This maturity is visible in the way Bitcoin now handles periods of low volatility, often moving in a more calculated and less erratic manner.
The weekend price action, specifically on a Sunday like February 22, often reflects a "thin" market where smaller trades can have a larger impact on price. However, with the integration of 24/7 institutional trading desks, the old "weekend gap" phenomenon has become less of a concern.
Instead, we look for signs of accumulation during these quiet periods. The steady price holding above $67,000 suggests that large-scale holders are comfortable with current valuations and are not rushing to exit their positions.
Bitcoin Price Prediction (BTC) February 22, 2026
Synthesizing the technical data, the bitcoin price prediction (BTC) February 22, 2026, points toward a target range of $67,500 to $69,200. The most likely scenario is a continuation of the gradual climb toward the $68,300 resistance.
If the Bollinger Band squeeze resolves to the upside, a brief spike toward $69,000 is highly probable as short-sellers are forced to cover their positions.
However, traders should remain cautious of a potential "stop hunt"—a quick dip below $67,000 to shake out leveraged long positions before the real move upward begins.
Given the positive MACD and the price staying above the BB basis, the bias remains cautiously bullish. The key will be whether the price can break and hold above the $68,357 upper band with a noticeable increase in trading volume.
Conclusion
Bitcoin is currently in a high-stakes waiting game. The technical indicators on the BTC/USDT pair suggest that the period of calm is about to end.
With the MACD trending upward and the Bollinger Bands tightening, the setup for a move toward $69,000 is on the table, provided the $66,210 support remains intact. For the best results, market participants should watch for a decisive 4-hour candle close outside the current Bollinger Band range to confirm the next trend.
FAQ
Why is the btc price today so stable?
The current stability is the result of a balance between supply and demand following a period of price correction. This consolidation allows the market to neutralize overbought or oversold conditions, setting the stage for the next major price trend.
What does a Bollinger Band squeeze mean for Bitcoin?
A squeeze occurs when the upper and lower bands move closer together. It indicates very low volatility and is historically a precursor to a large price movement. It does not predict the direction, but it warns that a big move is coming.
Is the MACD crossover a reliable buy signal?
While a MACD crossover is a strong indicator of shifting momentum, it is most effective when used with other tools like support/resistance levels and volume. In the current chart, the crossover supports a bullish outlook but requires a price breakout for confirmation.
What are the risks of trading Bitcoin this weekend?
The main risk during the weekend is lower liquidity, which can lead to "fakeouts" or sudden price swings that don't necessarily reflect the long-term trend. Always use stop-loss orders to protect your capital in these conditions.
How to Buy Crypto on Bittime

Want to trade sell buy Bitcoins and crypto investment easily? Bittime is here to help! As an Indonesian crypto exchange officially registered with Bappebti, Bittime ensures every transaction is safe and fast.
Start with registration and identity verification, then make a minimum deposit of IDR 10,000. After that, you can immediately buy your favorite digital assets!
Check the exchange rate BTC to IDR, ETH to IDR, SOL to IDR and other crypto assets to find out today's crypto market trends in real-time on Bittime.
Also, visit the Bittime Blog for interesting updates and educational information about the crypto world. Find reliable articles about Web3, blockchain technology, and digital asset investment tips designed to enrich your crypto knowledge.
Disclaimer: The views expressed belong exclusively to the author and do not reflect the views of this platform. This platform and its affiliates disclaim any responsibility for the accuracy or suitability of the information provided. It is for informational purposes only and not intended as financial or investment advice.

.png)