Bitcoin Price Prediction for June 5, 2026: After Breaking US$62,000, Where Will BTC Go Next?
2026-06-04
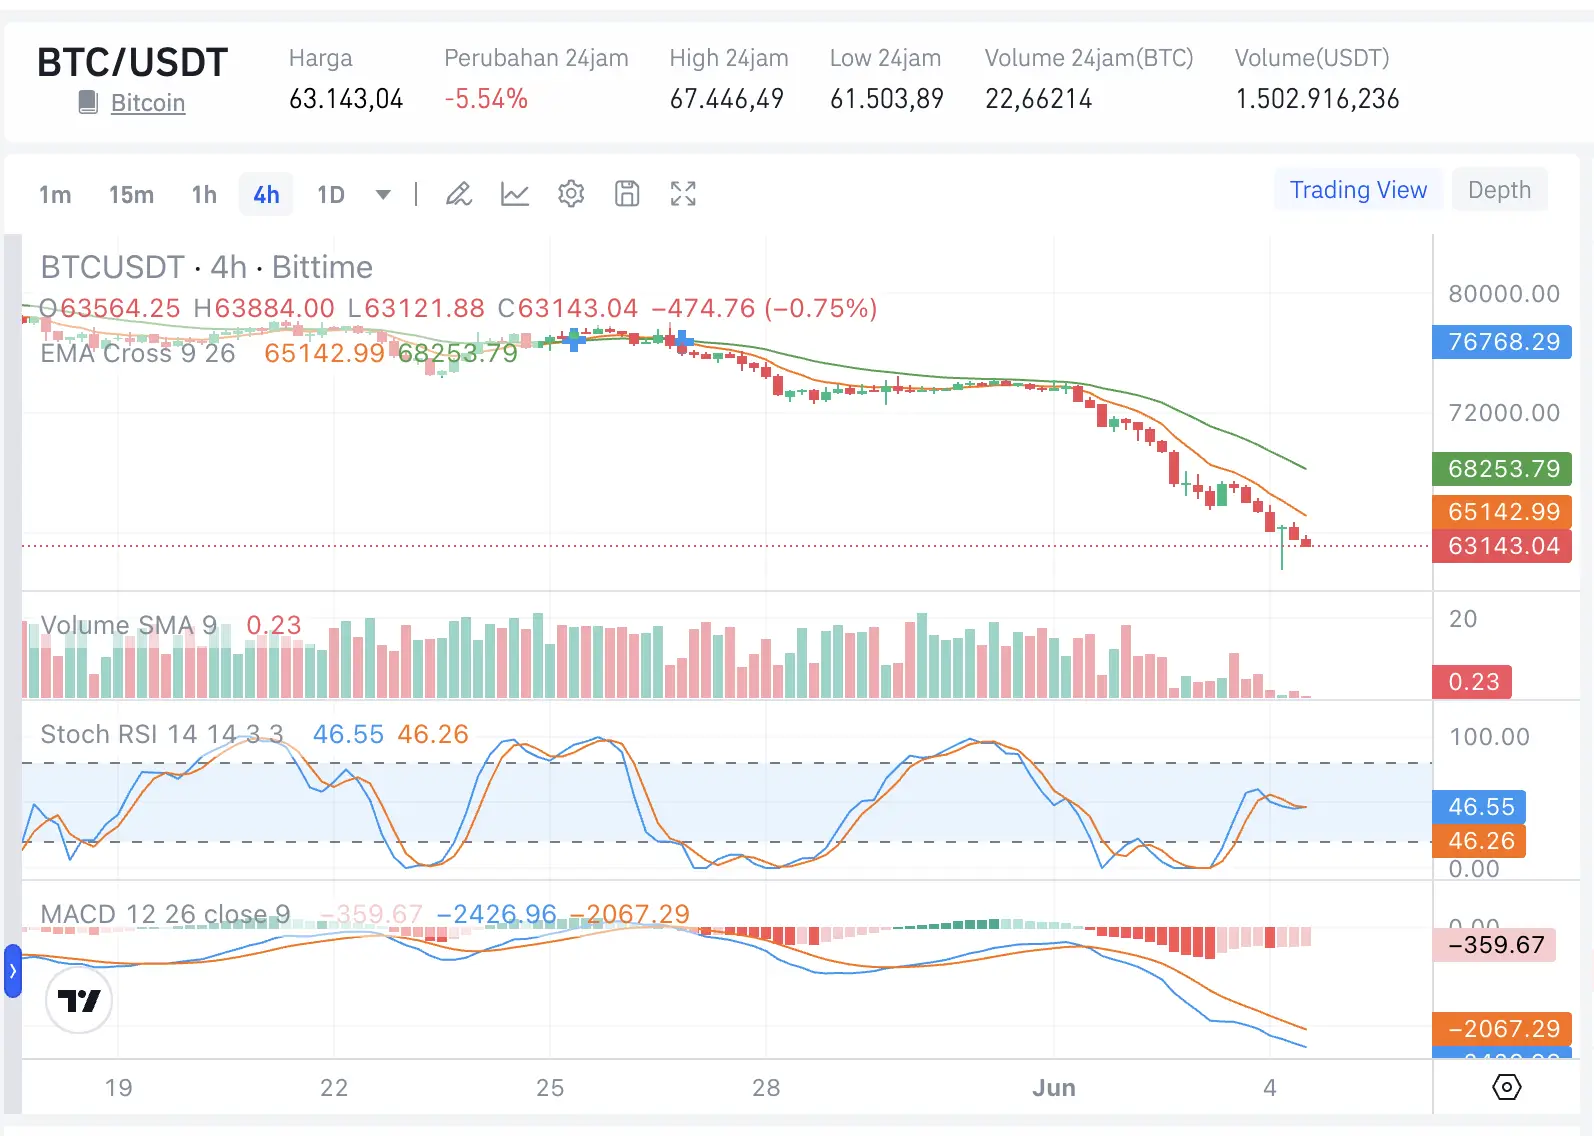
Bittime - Bitcoin (BTC) returned to the spotlight after experiencing sharp selling pressure in early June 2026. Based on Bittime data as of June 4, 2026, the price of Bitcoin (BTC) was in the rangeUS$63.143, down5.54% in the last 24 hours.
During that period, BTC touched its highest levelUS$67.446before falling toUS$61.504, showing very high volatility in the crypto market.
This decline occurred amid a combination of negative factors, ranging from outflows of spot Bitcoin ETF funds, massive liquidations in the derivatives market, to increasing risk-off sentiment in global markets.
The question now is, is Bitcoin approaching a local bottom or is it still at risk of falling further?
Key Points
Bitcoin fell 5.54% in 24 hours and is trading at US$63,143.
The price is still below the EMA 9 (US$65.143) and EMA 26 (US$68.254).
The nearest support is at US$61,500, while the main resistance is at US$65,000.
Register at Bittime now and start trading crypto with a fast, safe, and easy process in the app.
Bitcoin Remains in a Short-Term Bearish Trend
From a technical perspective, Bitcoin's condition still shows no signs of strong recovery.
Based on Bittime's 4-hour chart, BTC price is currently below two important trend indicators:
MOTHER 9:US$65.143
MOTHER 26:US$68.254
Current price:US$63.143
The price position below the 9-day and 26-day EMAs indicates that sellers continue to dominate the market in the short term. As long as Bitcoin cannot re-break the US$65,000 area, bearish pressure remains the primary scenario.
Additionally, the downward pattern that has been forming since late May shows a series of lower highs and lower lows, which is characteristic of a downtrend.
Read also:Crypto Market Cap Drops to US$2.31 Trillion Today, What Does This Mean for Bitcoin and Altcoins?
Bitcoin ETF Outflows Weigh Down Market Sentiment
One of the biggest fundamental factors weighing on Bitcoin right now is the outflow of funds from spot Bitcoin ETFs in the United States.
In recent weeks, Bitcoin ETFs have recorded billions of US dollars in outflows. This is despite spot ETFs being one of the largest sources of demand for Bitcoin during the 2024 to early 2026 rally.
When institutions began withdrawing funds from ETFs, the market lost one of the main pillars that previously supported prices. As a result, selling pressure became more likely to dominate buying pressure.
For short-term investors, ETF flow developments remain an important indicator to monitor in the coming days.
Read also:If You Bought 1 Million Rupiah of Bitcoin in 2016, How Much Would It Be Worth Now?
Wave of Liquidations Accelerates Bitcoin's Downfall
In addition to pressure from ETFs, the market is also experiencing what is known asleverage flush.
Many traders took long positions with high leverage while Bitcoin was still above US$70,000. When the price began to fall and broke through several key support areas, the system automatically liquidated these positions.
This domino effect is what caused Bitcoin's decline to occur so rapidly.
Massive liquidations usually cause prices to fall deeper than normal spot selling pressure because traders are forced out of the market with no choice.
What Do Technical Indicators Say?
Several indicators show that selling pressure remains dominant, although the rate of decline is starting to slow.
MACD Still Bearish
The MACD indicator is still in the negative area with the MACD line below the signal line.
This indicates that the bearish momentum is still active and there is no confirmation of a trend reversal.
Stochastic RSI Not Yet Extremely Oversold
The Stochastic RSI value is around level 46.
This means the market is far from overbought conditions, but has not yet reached the extreme oversold area that often signals a price rebound.
In other words, there is still a possibility of continued volatility before the market finds a clearer direction.
Support and Resistance Levels to Watch Out For
Based on the current price structure, there are several important levels that traders should focus on.
Support
US$61,500 (latest daily low)
US$60,000 (psychological support)
US$58,000 (next major support)
Resistance
US$65.000
US$68.000
US$70.000
The US$61,500 area is a crucial level. If this support fails to hold, the market could potentially test the US$60,000 to US$58,000 area.
Conversely, if Bitcoin manages to break through US$65,000 again, the opportunity for a relief rally towards US$68,000 will begin to open.
Read also:The Crypto Fear and Greed Index Drops to 26, Is the Crypto Market Nearing a Turning Point?
Bitcoin Price Today, June 4, 2026
Based on Bittime trading data on June 4, 2026, the price of Bitcoin (BTC) is in the range US$63.143, down about 5.54% in the last 24 hours.
BTC to USDT via Bittime Market
During that period, BTC reached its highest levelUS$67.446before declining to its lowest pointUS$61.504.
Quite aggressive selling pressure has made Bitcoin trade again below the indicatorEMA 9 (US$65.143) And EMA 26 (US$68.254), which indicates a short-term trendstill tends to be bearish.
This decline occurred amid increased profit-taking, outflows from spot Bitcoin ETFs, and the liquidation of leveraged positions in the derivatives market, which accelerated the price decline in recent days.
Bitcoin Price Prediction June 5, 2026
Currently the market is still in a phase of high uncertainty.
Bull Case
If selling pressure subsides and ETF outflows begin to slow, Bitcoin could potentially break through US$65,000 again and test resistance in the US$68,000 to US$70,000 area.
Base Case
The most realistic scenario at this point is consolidation in the US$61,500 to US$65,000 range while awaiting new sentiment from the institutional market.
Bear Case
If the US$61,500 support is broken and selling pressure increases again, Bitcoin could potentially fall towards the US$60,000 or even US$58,000 area in the short term.
Conclusion
Bitcoin entered June 5, 2026, in a still-vulnerable position, having fallen 5.54% in the past 24 hours to US$63,143. The main pressure came from a combination of ETF outflows, leveraged liquidations, and global risk-off sentiment.
Technically, BTC is still moving below the 9-EMA and 26-EMA, while the MACD has not shown any convincing reversal signals.
As long as the price is unable to reclaim the US$65,000 area, investors should anticipate high volatility and a possible retest of the US$61,500 support in the coming days.

Bittime is a licensed and regulated Digital Financial Asset Trader (PAKD) supervised by Indonesia’s Financial Services Authority (OJK) — where you can buy Bitcoin in Indonesia and hundreds of other crypto assets starting from just Rp10,000. The registration process is fast, secure, and you can get started today.
Track USDT to IDR conversions and monitor your favorite crypto assets in real time. Everything is available in one crypto investment app that you can download for free on the Play Store
Ready to start? Register now on Bittime and execute your investment strategy with a platform trusted by millions of users in Indonesia.
FAQ
What is the price of Bitcoin today?
According to Bittime data as of June 4, 2026, the price of Bitcoin was around US$63,143.
Why did Bitcoin drop sharply?
The decline was triggered by ETF outflows, liquidation of leveraged positions, and global risk-off sentiment.
Is Bitcoin still bearish?
In the short term, the trend is still bearish as the price is below the EMA 9 and EMA 26.
Where is Bitcoin support currently?
The nearest support is in the area of US$61,500 and US$60,000.
Can Bitcoin rebound?
Yes, but BTC needs to break back above the $65,000 area to alleviate the current bearish pressure.
Disclaimer: The views expressed belong exclusively to the author and do not reflect the views of this platform. This platform and its affiliates disclaim any responsibility for the accuracy or suitability of the information provided. It is for informational purposes only and not intended as financial or investment advice.

.png)