Latest Bitcoin Price Prediction for March 25, 2026
2026-03-24
Bitcoin (BTC) once again showed an interesting price movement in trading on March 24, 2026. Based on the BTC/USDT chart on the 4-hour timeframe on Bittime, BTC price moved in a recovery phase after a short correction, with price once again holding above the middle line of the Bollinger Bands.
Daily price analysis remains important for reading the short-term trend direction, especially as BTC approaches a new resistance area. By combining support and resistance levels, Bollinger Bands, Stochastic RSI, and MACD, traders can assess breakout opportunities and pullback potential more precisely.
In this article, we review the latest BTC/USDT price performance, technical analysis, and the Bitcoin price forecast for March 25, 2026 based on the latest market data and chart from Bittime as of March 24, 2026.
Key Takeaways
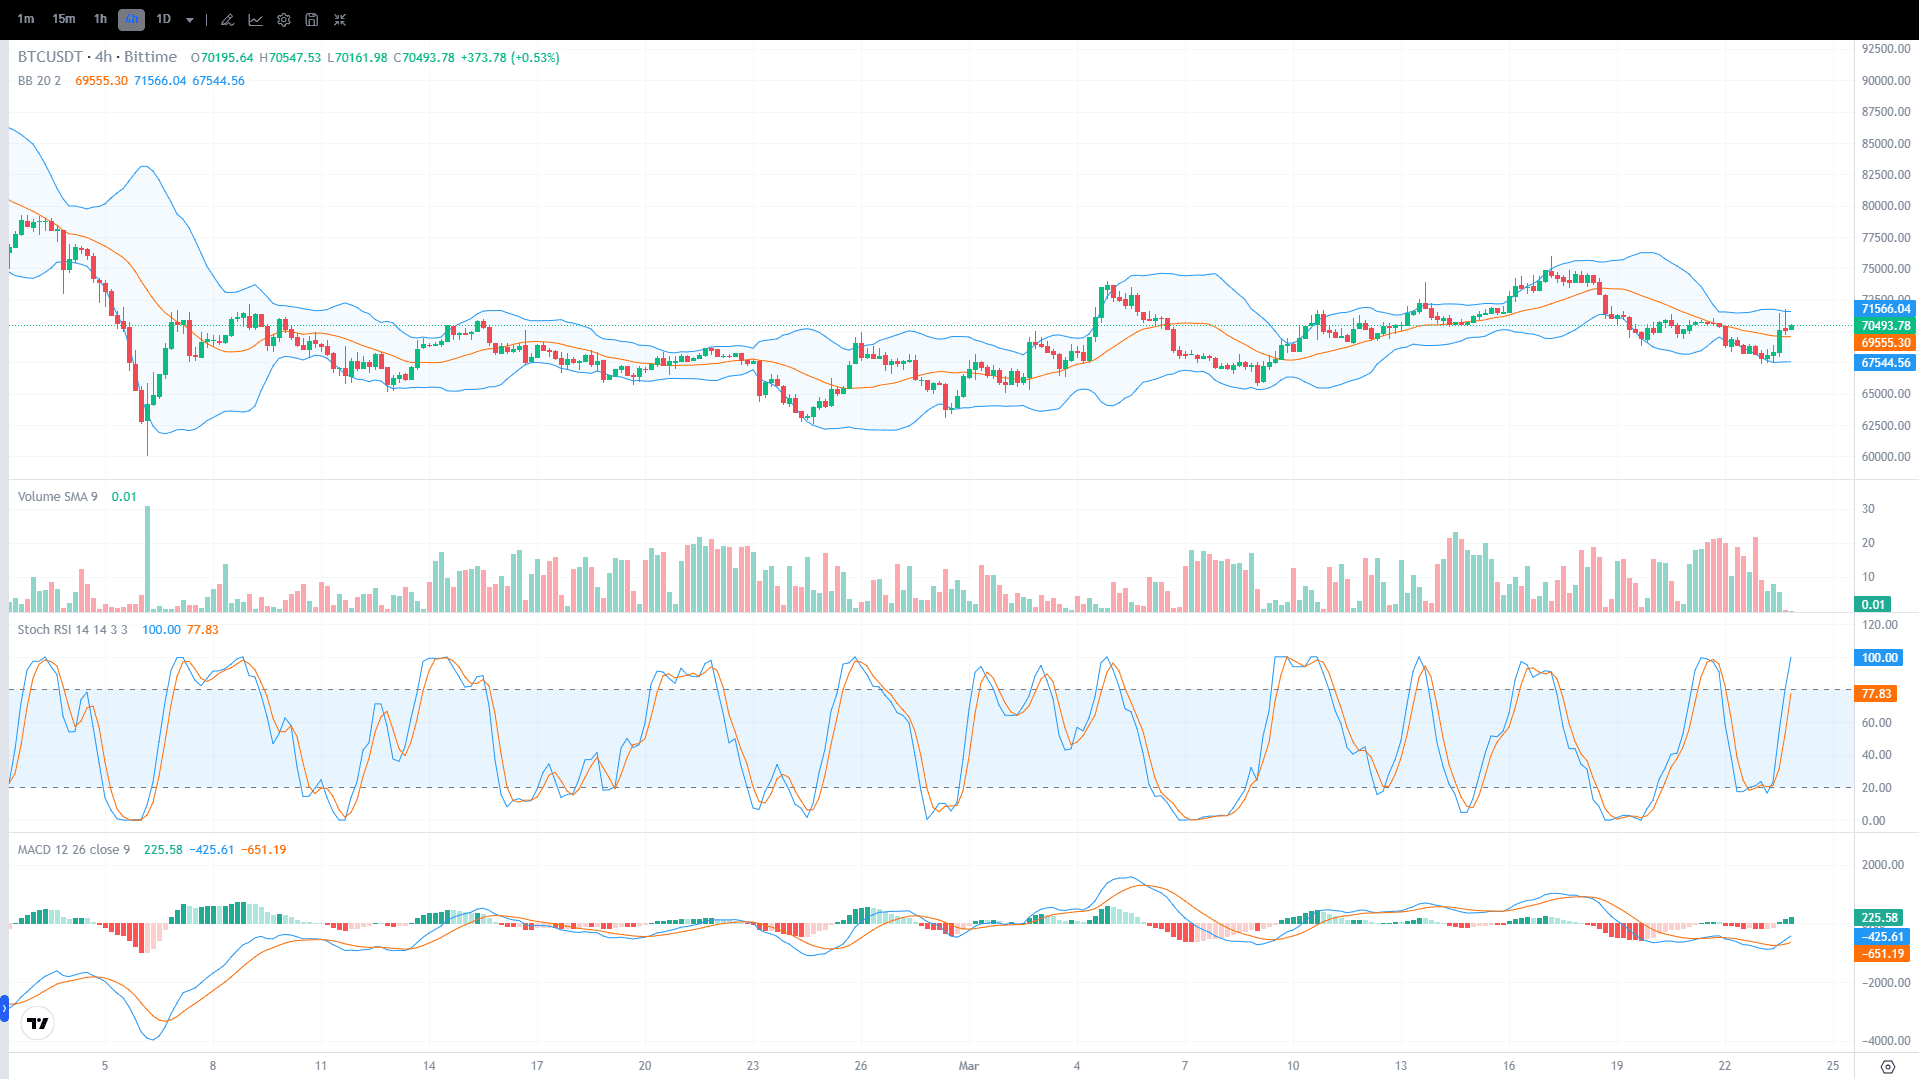
- BTC/USDT is currently moving in the $70.162 – $70.548 range and last closed around $70.494.
- The nearest resistance lies in the $70.548 – $71.566, while key support is at $70.162 followed by mid support around $69.555 and lower support at $67.545.
- As long as price remains above the middle Bollinger Bands area at $69.555, the short-term trend still tends to be neutral to positive. However, if this level breaks, the correction could widen to $68.500 – $67.545.
Monitor the latest BTC price and start trading BTC/USDT easily through the platformBittime today.

Register on Bittime now and start trading crypto through a fast, secure, and easy process in the app.
BTC Price Performance Today
Here is a brief overview of BTC/USDT price movement based on the 4-hour timeframe chart:
Note: Prices may differ across exchanges due to differences in liquidity, spread, and market order book depth.
Also Read: Dolomite (DOLO) Price Prediction: Trend & Sentiment Analysis
Historical Bitcoin Price Movement
Over the past few weeks, BTC/USDT has moved fluctuatively with a fairly long consolidation phase on the 4-hour timeframe. After experiencing a sharp correction at the beginning of the period, price slowly formed a new base and returned to moving steadily above the mid-support area.
From late February to March 24, 2026, BTC moved several times within the 65,000 to 75,000 USDT range. This movement shows that the market is still looking for a firmer direction, but the short-term price structure has started to improve after the latest candles moved back toward the local resistance area.
Overall, Bitcoin’s current price structure remains constructive for the short term. Price has returned above the middle Bollinger Bands line, while momentum indicators are beginning to show recovery although they have not yet fully entered a strong breakout phase.
Also Read: Polyhedra Network (ZKJ) Price Prediction: Short to Long Term
BTC Price Analysis Today – March 24, 2026
BTC/USDT is currently moving in a recovery to mildly bullish after coming under pressure in the previous session. The latest closing price around $70.493,78 is still above the middle Bollinger Bands line at $69.555,30, indicating that the short-term trend remains intact with a positive bias.
In terms of momentum, Stochastic RSI 100,00 dan 77,83 shows fairly strong buying acceleration in the short term. However, because the indicator is already approaching the upper area, the market also needs to watch for the possibility of temporary cooling or light consolidation before continuing higher.
The MACD indicator is beginning to show improving momentum. The MACD line at -425,61 is already above the signal line at -651,19, while the histogram is around 225,58. This indicates that bullish momentum is beginning to form, although structurally this recovery trend still needs confirmation through a breakout above nearby resistance.
As long as BTC is able to stay above the mid-support area and does not fall back below the middle Bollinger Bands line, the opportunity to test upper resistance remains open. However, if volume weakens as it approaches resistance, the market may move sideways first before determining its next direction.
Key BTC/USDT Levels
Nearest resistance: $70.548 – $71.566
Strong support: $69.555 – $67.545
The $70.548 area is the very near-term resistance because it marks the latest candle peak, while $71.566 is the upper band that could become the next barrier. Meanwhile, the $69.555 area serves as the main dynamic support that is very important for keeping the price structure constructive.
BTC Price Prediction for March 25, 2026
The Bitcoin price prediction for March 25, 2026 is expected to move within the $69.555 – $71.566, with the initial bias remaining neutral to bullish as long as price stays above the middle Bollinger Bands area.
If buying pressure rises again and the candle successfully breaks above $70.548, then BTC/USDT has the potential to test $71.000 up to $71.566. If the breakout is valid and supported by improving volume, the move could extend to higher levels.
Conversely, if short-term weakness occurs, price could first decline to the $70.162 – $69.555 area. If this support fails to hold, the risk of a wider correction toward $68.500 up to $67.545 will increase.
Also Read: Obol (OBOL) Price Prediction: Short, Medium, and Long Term
Factors Affecting BTC Price
For short-term movement, BTC/USDT is still heavily influenced by the combination of technical structure, market sentiment, and price reaction to the resistance area currently being tested.
Price Position Relative to Bollinger Bands
Price remaining above the middle Bollinger line shows that the short-term bullish bias is still intact. However, because price has not yet broken the upper band, the market still needs additional volume support for the breakout to continue.
Stochastic RSI
A high Stochastic RSI indicates that buying momentum is active. Although this supports the bullish scenario, a mild overbought condition can also trigger a pause in the advance or a short consolidation before price continues its trend.
MACD Begins to Strengthen
MACD already being above the signal line shows improving momentum. Although both lines are still in negative territory, the positive histogram shows that selling pressure is beginning to ease and room for recovery remains open.
Also Read: Maduro Memes (MADURO) Price Prediction: Chart Analysis and Potential
Potential Scenarios
Bullish Scenario
If BTC/USDT is able to break above $70.548 and then move steadily above that level, the next upside target would be in the $71.000 – $71.566 range. This scenario would become stronger if supported by continued green candles and rising volume.
Sideways Scenario
If the market has not yet received a new catalyst, BTC/USDT could move sideways in the $69.555 – $70.548 area. This scenario is quite realistic because price is currently between mid-support and nearby resistance.
Bearish Scenario
If price drops below $69.555, selling pressure could increase and push BTC/USDT toward the $68.500 area. If the weakness continues, the lower Bollinger support around $67.545 becomes the next correction target.
Conclusion
On March 24, 2026, BTC/USDT showed a short-term market structure that was beginning to improve, with price above the middle Bollinger Bands line. A high Stochastic RSI and a MACD that has started to turn positive signal that upward momentum is forming, although the market still needs breakout confirmation to continue a stronger advance.
For the March 25, 2026 forecast, the $70.548 area becomes the breakout key level, while the $69.555 area becomes the support that must be defended. As long as that support holds, the chance of rising toward $71.566 remains open. However, if support breaks, a deeper correction needs to be watched.
How to Buy Crypto on Bittime?

Want to trade and buy BTC and invest in crypto easily? Bittime is ready to help! As an Indonesian crypto exchange officially registered with Bappebti, Bittime ensures every transaction is secure and fast.
Start by registering and verifying your identity, then make a minimum deposit of Rp10,000. After that, you can immediately buy your favorite digital assets!
Check the rates BTC to IDR, ETH to IDR, SOL to IDR and other crypto assets to track today’s crypto market trends in real time on Bittime.
In addition, visit Bittime Blog to get various interesting updates and educational information about the crypto world. Find trusted articles on Web3, blockchain technology, and digital asset investment tips designed to enrich your knowledge in the crypto space.
FAQ
What are the main indicators visible on the BTC chart for March 24, 2026?
The main indicators visible are Bollinger Bands, Stochastic RSI, and MACD. All three show that price is still in a recovery phase with upward momentum beginning to form.
Why is the $69.555 area important for BTC/USDT?
Because this area is the middle line of the Bollinger Bands, which is currently acting as dynamic support. As long as price stays above this level, the short-term price structure is still considered healthy.
Does BTC have the potential to rise again on March 25, 2026?
That possibility still exists as long as price can stay above the main support and break the nearby resistance in the $70.548 area. If a breakout occurs, the nearest target points to $71.566.
Is the bearish signal already strong?
Not yet very strong. What currently looks more dominant is recovering momentum. The bearish signal would become more valid if price falls below $69.555 and MACD weakens again with a negative histogram.
How can you monitor BTC price movements in real time?
BTC price can be monitored through crypto trading platforms, exchange apps, or chart services that provide live BTC/USDT updates along with technical indicators.
Disclaimer: This content is for educational and informational purposes only. We are not financial advisors. Crypto investing carries high risk and may result in losses. Do your own research before investing. All decisions are the user’s responsibility.
Disclaimer: The views expressed belong exclusively to the author and do not reflect the views of this platform. This platform and its affiliates disclaim any responsibility for the accuracy or suitability of the information provided. It is for informational purposes only and not intended as financial or investment advice.

.png)