XRP Price Movement This Week, The Last Week of April 2026
2026-04-22
2026 remains a dynamic period of fundamental formation for the crypto asset ecosystem, and Ripple (XRP) is at the center of attention for both institutional and retail market participants.
After a phase of extreme volatility and a price rally that broke through the psychological level above $3.00 in the previous cycle, the movement of XRP throughout the first quarter of this year was dominated by a distribution phase and a structured correction.
Global macroeconomic dynamics, updated tokenomics, as well as the escalation of XRP Ledger integration by various banking entities, continue to be a solid long-term catalyst.
However, from a short-term price action perspective, the market is currently trying to find a new equilibrium point.
Through the glasses, XRP price analysis. In depth, the last week of April 2026 is a crucial point for analysts and investors to map the direction of the next quarter's trends.
Key Points
- The XRP price is currently entering a consolidation phase at the equilibrium level of $1.45, indicating that selling pressure is starting to ease after a long correction.
- Technical indicators such as RSI are approaching oversold levels, and a potential bullish crossover on MACD gives an early signal of weakening bearish momentum.
- This stabilization phase with quieter volumes presents a rational momentum for long-term investors to accumulate assets through strategies such as Dollar Cost Averaging (DCA).
XRP Price Analysis This Week: End of April 2026
Based on the latest daily technical chart readings, XRP's movement this week shows very clear signs of volatility cooling.
The asset price is currently consolidating and trading in the local equilibrium range at the $1.45 level.
Several key indicators confirm that selling pressure is starting to ease measurably:
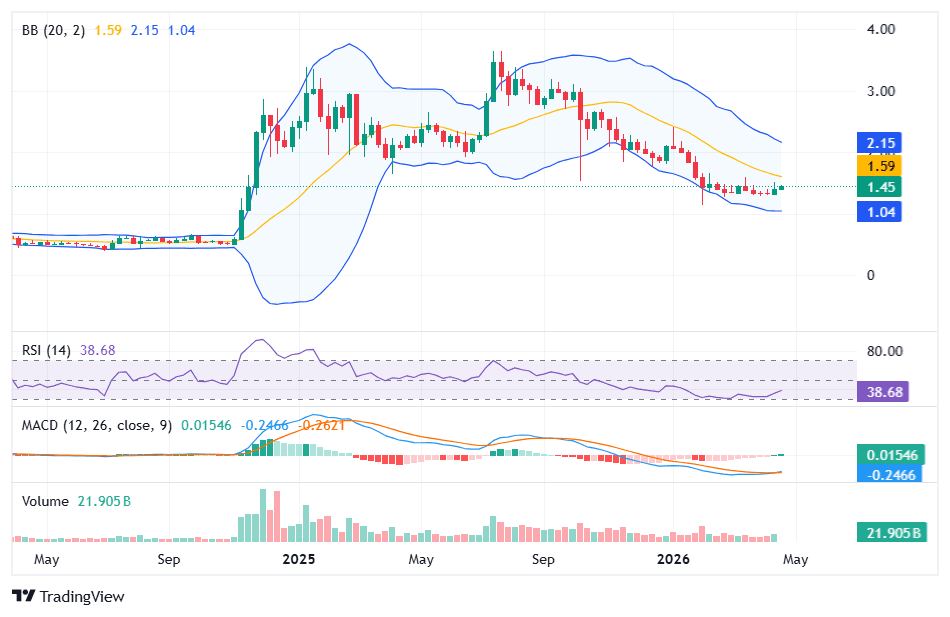
Structure Bollinger Bands (20, 2)
The current price position is belowSimple Moving Average(SMA) 20 days, perched at $1.59.
However, the price is no longer sticking aggressively to the lower band, which is at the level of $1.04.
The distance between the upper band ($2.15) and the lower band is starting to show moderate narrowing, which in technical literature indicates volatility compression, a phase that usually precedes a new directional move.
Momentum Relative Strength Index (RSI 14)
The RSI indicator is currently at 38.68. This figure places XRP in the neutral-lower zone, slowly approaching the threshold oversold at level 30.
This condition proves that the dominance of sellers (bears), which has been suppressing prices for the past few months is starting to run out of ammunition, making room for buyers (bulls) to build defenses.
MACD signal (12, 26, 9)
Indicators, Moving Average Convergence Divergence, present the most interesting data to anticipate. The MACD histogram has turned slightly positive at 0.01546 (in green).
In addition, the MACD line (-0.2466) started to slope down and head upwards, trying to cross the signal line (-0.2621).
Potential bullish crossover. This is an early indicator of a shift in market momentum.
Trading Volume
Recorded at 21.905 billion, the current volume appears much more stable and calm compared to the speculative volume that triggered the spike in the past.
Volume that dries in the areas of support is often an indication of a phase of institutional accumulation.
3 XRP Price Movement Scenarios Next Week
Looking at the technical indicator balance above, the movement projections for early May can be mapped into three main probability scenarios.
Bullish Scenario
If the momentum from the green MACD histogram is confirmed by the influx of significant buying volume, XRP's first resistance target will be to break through the middle Bollinger Band line at $1.59.
If this level is successfully changed fromresistance become support (S/R flip), scenario bullish will be validated, paving the way for the price to test the psychological area of $1.80 until it touches the upper band (upper band) at $2.15 in the next few weeks.
Bearish Scenario
Downside risks still loom if a macro sentiment shock forces the crypto market into an aggregate correction.
In the bearish scenario, if XRP fails to maintain the zone supporting the $1.35 range, this asset has the potential to slide back to test liquidity at the lower Bollinger band at the $1.04 level.
A drop to this level will automatically pull the RSI into bearish territory, extreme oversold.
Neutral Scenario
Given the relatively flat trading volume, the highest probability scenario at the moment is a sideways move.
Prices are likely to continue to fluctuate within a tight range between $1.35 and $1.60.
Read Also: XRP Price Prediction for April 2026 - Technical Analysis and Prediction
This neutral phase is a continuation of the asset distribution process that moves from weak hands to long-term investors who are accumulating.
Is now a good time to invest in XRP?
Determining the right time (market timing) always depends on the risk profile and investment horizon of each individual.
However, if judged from XRP price analysis, technically, the price position at $1.45 with RSI at 38 offers a good risk-reward ratio (risk-to-reward ratio) which is quite asymmetric for medium and long-term investors.
The current price has seen a substantial discount from its highs. For investors who believe in the network's fundamentals, the cross-border settlement utility (cross-border settlement), and structured tokenomics, XRP is deflationary. This consolidation area is a rational zone to implement the strategy Dollar Cost Averaging (DCA).
Compared to buying when the price is rallying (Fear of Missing Out/FOMO), accumulating assets when momentum indicators show a cooling down is much more measured in risk management.
Final Notes
The close of April 2026 shows that XRP is in a crucial phase of finding its direction.
The MACD and RSI indicators simultaneously highlight that historical selling pressure has subsided, while the narrowing of the Bollinger Bands suggests that this consolidation phase will not last forever.
Monitoring XRP price movement in the $1.45 area is very important, because the market reaction at this equilibrium level will dictate whether May will start with a reversal (reversal) solid or continuation of the accumulation trend. Investors are advised to continuously monitor volume confirmation before executing large-scale trading positions.
FAQ
Why did the price of XRP fall sharply from its high of $3.00?
XRP price experienced a structured correction from its highs due to profit taking (profit taking) is a reasonable move for investors after the massive rally in the 2024-2025 cycle. Furthermore, global macroeconomic dynamics forcing liquidity adjustments in the overall crypto market also triggered a distribution phase, bringing XRP back to its current technical equilibrium point around $1.45.
Does the XRP price have the potential to break through $2.00 again in 2026?
Based on current technical analysis, the chances of XRP returning to the $2.00 level are still very much open. The MACD indicator is starting to show potential Bullish crossover. This indicates that downward momentum is starting to weaken. If institutional and retail buying volumes return and the price breaks through the nearest resistance at $1.59, the next target will be the upper Bollinger Bands at $2.15.
What are the most accurate technical indicators to monitor XRP price movements today?
No single indicator is perfect, but the combination of MACD, RSI (Relative Strength Index), and Bollinger Bands provides a comprehensive picture. The RSI is particularly useful for detecting when XRP is becoming oversold (oversold), while Bollinger Bands map price volatility ranges, and MACD confirms early changes in trend direction or momentum.
Is it the best time to buy when the XRP RSI approaches the oversold area?
When the RSI indicator approaches the level of oversold (below 40), this is often read by analysts as the point where selling pressure has become saturated, and the asset is starting to move into discount territory. While this is an attractive accumulation zone in terms of risk-to-reward, the crypto market remains high risk. Strategy Dollar Cost Averaging(DCA) is much more recommended than a lump sum purchase (lump-sum) to mitigate the risk of further volatility.
Besides chart analysis, what are the fundamental factors driving the current price of XRP?
While technical analysis reads short-term market psychology, XRP's macro trend movements are driven by fundamental factors such as the escalation of adoption of XRP Ledger technology by banking institutions for cross-border payment settlements (cross-border settlement), clarity of digital asset regulations globally, and updates to tokenomics within the Ripple ecosystem itself.
Disclaimer: The views expressed belong exclusively to the author and do not reflect the views of this platform. This platform and its affiliates disclaim any responsibility for the accuracy or suitability of the information provided. It is for informational purposes only and not intended as financial or investment advice.

.png)