Wormhole (W) Price Soars, Will It Break US$0.03?
2026-10-12
Wormhole’s price surged toward US$0.03, but the data reviewed has not shown a breakout above that level. As of the October 12, 2026 check, the W token was trading around US$0.02930, up approximately 67.5% over 24 hours, with a high of US$0.02978.
The small gap to US$0.03 makes the price response around this area worth watching. If you are following W’s movement, assess whether the rally can continue by examining candle closes, trading activity, and the price’s ability to hold after testing that level.
Key Takeaways
- Wormhole is approaching US$0.03, but a breakout has not appeared in the data reviewed.
- The chart shows the price above the upper Bollinger Band, indicating strong momentum that still carries a risk of correction.
- Confirming further gains requires monitoring candle closes, volume, and the price response during a retest.
Wormhole’s Price Surges: What Does the Chart Show?
The reference chart uses 24-hour candles and shows a price of around US$0.02904. The latest candle opened at US$0.02188 and reached a high of US$0.02977, with a displayed change of 32.49%.
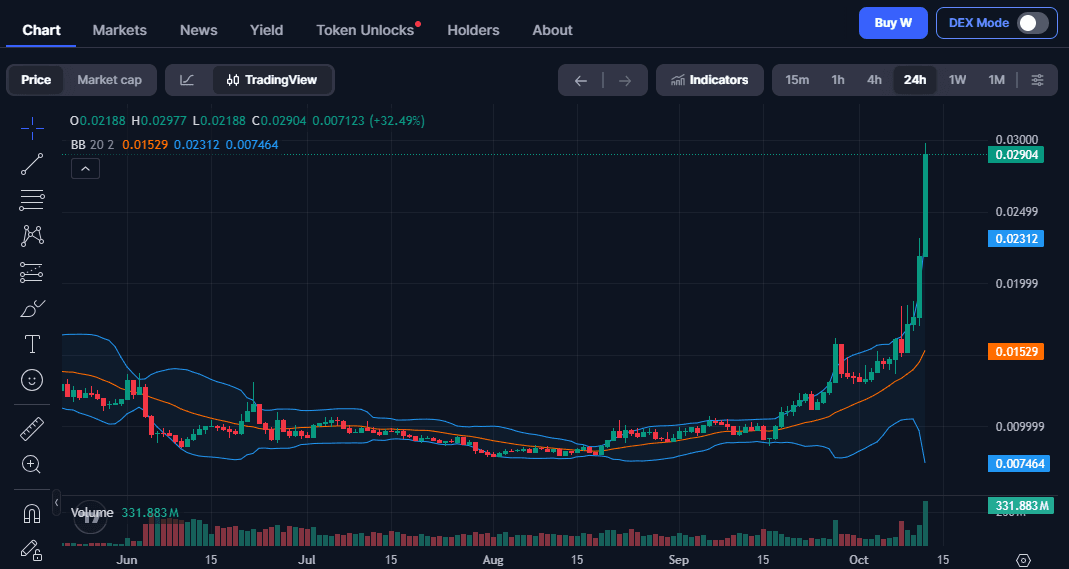
Visually, W moved from a relatively flat phase into an increasingly sharp rise. The volume bars toward the end of the chart also grew, indicating increased trading activity during the advance.
The candle’s percentage change needs to be distinguished from the 61.39% gain in an earlier news report. That report recorded a price of US$0.02842 and a high of US$0.02945 in its snapshot.
The percentage change from a candle’s opening price to its latest price is not always the same as the change over a rolling 24-hour period. News figures, charts, and market updates should therefore be interpreted according to their timing and measurement methods.
Read also: MetaCraft (MCT) Price Prediction: Can MCT’s Price Recover?
What Are Wormhole and the W Token?
Wormhole is a cross-blockchain communication protocol that supports messaging and the development of applications across networks. Its infrastructure allows applications to interact with other blockchain ecosystems , including for asset and data transfers.
The W token plays a role in governing the Wormhole ecosystem. Through mechanisms supported by the protocol, token holders can participate in decisions about its development direction.
This utility provides fundamental context for readers who are new to W. However, a short-term price increase alone is not enough to demonstrate increased protocol usage or a change in its fundamental value.
Read also: CyberLeek Rises Today: Reasons Behind the Move and Price Analysis
What Is Driving Wormhole’s Rise?
The available data shows increases in price and trading activity, but it is not enough to establish a single main catalyst. The references reviewed provide no basis for concluding that this surge was specifically caused by a new listing, purchases by major investors, or a partnership announcement.
Rising volume helps show that the move involves greater market activity. However, volume includes both buying and selling transactions, so it cannot independently establish that a particular group is accumulating tokens.
To assess the reasons for the rise more reliably, readers need to compare the timing of the move with official announcements and broader market developments. If that evidence is unavailable, the most accurate explanation remains limited to the visible price momentum.
Wormhole Technical Analysis and Key Price Levels
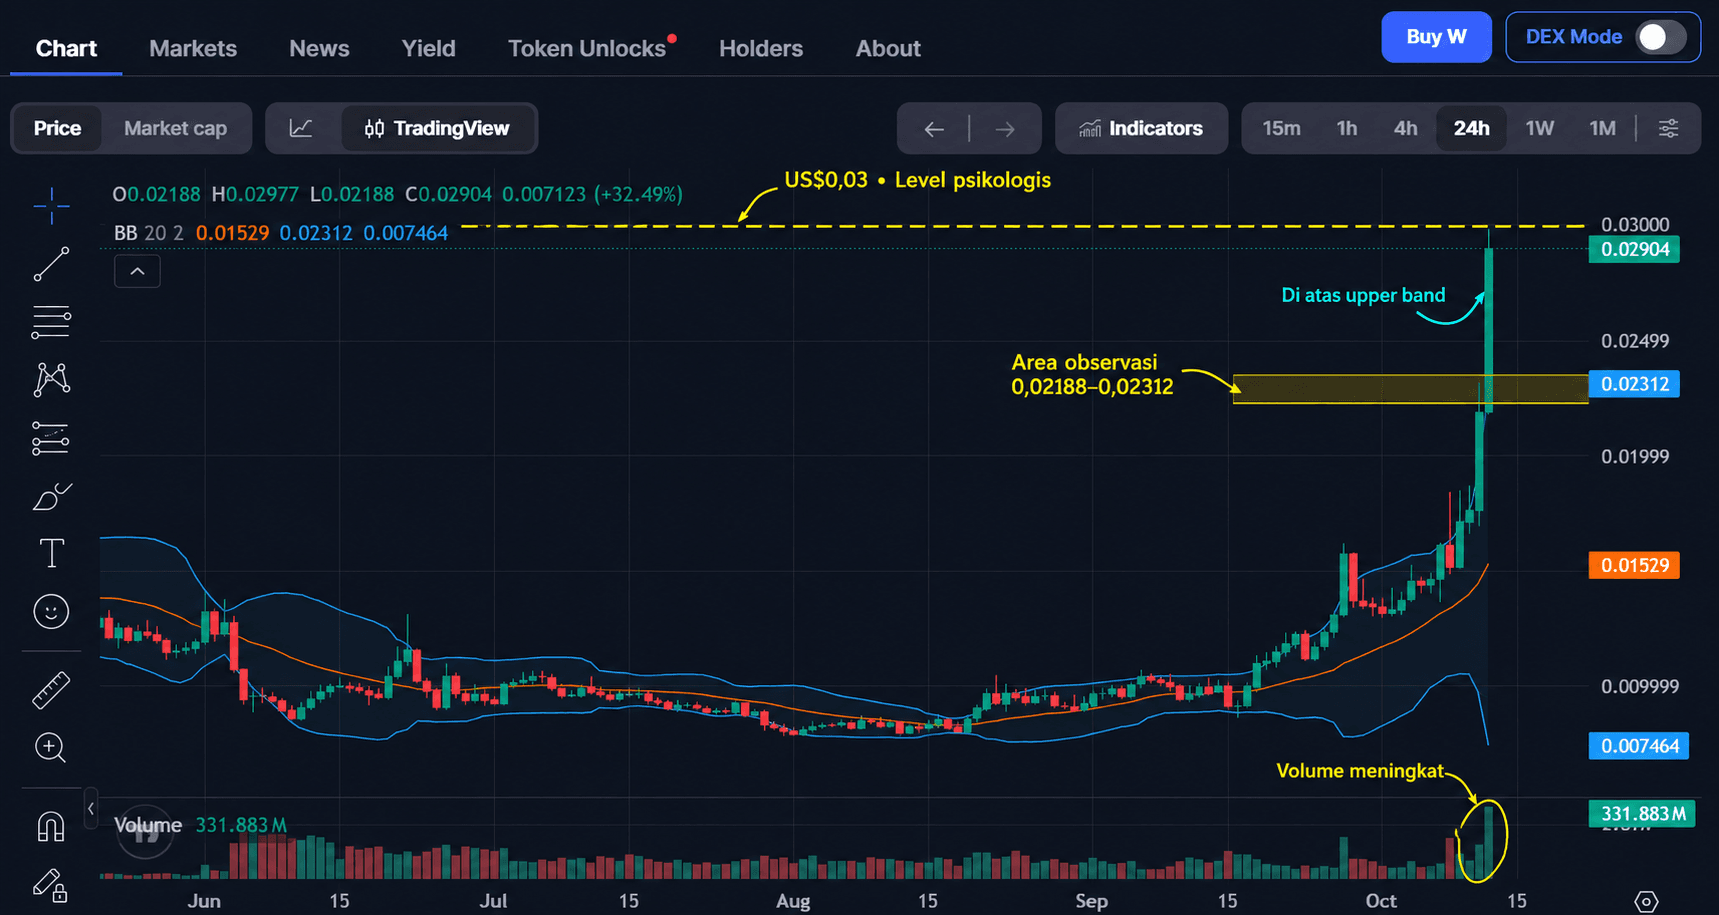
US$0.03 Is the Nearest Psychological Level
The US$0.02977–US$0.03 area is the nearest zone to watch, based on the chart’s high and the round number above it. A single test is not enough to classify this zone as strong historical resistance.
A price that touches or briefly exceeds US$0.03 does not automatically indicate a sustained breakout. A candle close above it would provide more useful information than a brief move while the candle is still forming.
If the price then retests the area, its subsequent response can help assess the strength of demand. Holding above it supports a continuation scenario, while falling back below it weakens the initial confirmation.
The Price Is Above the Upper Bollinger Band
The chart uses Bollinger Bands with a 20-period setting and two standard deviations. In the snapshot, the upper band is around US$0.02312, while the middle line is around US$0.01529.
A price above the upper band indicates that the move has exceeded the indicator’s upper range at that point. This can accompany a strong trend, so it should not be used as the sole reason to conclude that the price will soon reverse downward.
This indicator also changes continuously as new candle data becomes available. The values shown in the image need to be updated before being used in subsequent analysis.
Areas to Watch if the Price Weakens
If the price declines, the range around US$0.02188–US$0.02312 can serve as an observation area based on the snapshot. Its lower boundary is the latest candle’s opening price, while its upper boundary comes from the upper Bollinger Band.
This range is not yet confirmed support. Readers need to see whether the price holds in this area, moves sideways, or breaks through it without a meaningful recovery.
The middle Bollinger Band, farther below the price, provides context for the scale of the move’s expansion. Its position does not mean that the price will definitely return to that line.
Read also: ZEUS Coin After a 129% Rise: Further Correction or Another Recovery?
Will Wormhole’s Price Keep Rising or Correct?
The US$0.03 Breakout Scenario
The bullish scenario gains support if a candle on the analyzed timeframe closes above US$0.03. Sustained strong trading activity can add evidence that the move has market participation.
Further confirmation comes from the price’s ability to hold the breakout area when it is retested. If the price continues forming higher lows, the uptrend develops a more orderly structure than a single surging candle.
The available chart does not provide sufficient grounds to set a specific next target. Adding figures such as US$0.04 or US$0.05 without a supporting price structure would make the projection more speculative.
The Rejection and Correction Scenario
A correction scenario deserves attention if the price repeatedly approaches US$0.03 but closes lower. Long upper candle wicks can suggest selling pressure, especially if subsequent candles weaken.
An initial correction does not always end the entire uptrend. The distinction depends on the depth of the decline, the response around previous price areas, and the market’s ability to recover.
A price that rises again but fails to exceed its previous high indicates weaker momentum. Conversely, sideways movement with limited downside may reflect consolidation, although the eventual direction still needs confirmation.
Read also: USDP Coin Price Prediction: How Realistic Is the US$1 Target?
Three Things to Monitor After the Surge
- Candle closes. Use a consistent timeframe so that intraday movements are not treated as confirmation on the daily chart.
- Volume during rises and declines. Compare it with previous periods to understand changes in activity, rather than focusing on a single large bar.
- Broader market conditions. Changes in the direction of major assets can affect interest in altcoins and disrupt W’s technical scenarios.
Also record the observation time when comparing prices across platforms. Differences between snapshots can make analyses appear contradictory even when they cover different periods.
Risks to Understand
Sharp moves can encourage rushed decisions driven by fear of missing out on further gains. However, entering at a price increasingly far from the area where the trend formed can magnify the impact of a market reversal.
Another risk is a false breakout, where the price moves beyond a level but fails to hold it. This is why analytical scenarios need clear conditions for reassessment.
You also need to distinguish price direction analysis from trade risk management. Even a reasonable forecast can fail, so position sizes and loss limits must align with your ability to bear risk.
Conclusion
Wormhole’s price shows strong momentum, but the continuation of its rise still depends on the response around US$0.03. Candle closes and price behavior after a retest are more useful than treating proximity to the level as a guarantee of a breakout.
If you want to start using Bittime, you can sign up for Bittime and review the available assets and services before trading.

Bittime is a Digital Financial Asset Trader (PAKD) platform licensed and supervised by Indonesia’s Financial Services Authority (OJK), where you can buy Bitcoin in Indonesia and hundreds of other crypto assets starting from IDR 10,000. Registration is quick and secure, and you can get started today.
Track the USDT to IDR conversion rate and your favorite crypto assets’ price movements in real time. Everything is available in one crypto investment app that you can download for free from the Play Store.
Ready to get started? Sign up for Bittime now and execute your investment strategy on a platform trusted by millions of users in Indonesia.
FAQ
Why is Wormhole’s price rising?
The data shows increased price and trading activity. However, the references reviewed are not enough to establish a specific catalyst as the main cause of the surge.
Can Wormhole’s price break above US$0.03?
It is possible, but it has not been confirmed in the snapshot analyzed. A candle close above that level and the ability to hold it would support the bullish scenario.
Which Wormhole support and resistance levels should you monitor?
The US$0.02977–US$0.03 area is the nearest upper zone to watch on the chart. Below it, US$0.02188–US$0.02312 is an observation range, not proven support.
What does it mean when Wormhole’s price is above the upper Bollinger Band?
The price has moved beyond the indicator’s upper boundary in that snapshot. This can accompany strong momentum, but it does not guarantee either continued gains or an imminent correction.
What are the risks after Wormhole’s price surges?
Risks include high volatility, false breakouts, and entering after the price has already moved too quickly. Readers need to evaluate price confirmation and their ability to absorb losses.
Disclaimer: The views expressed belong exclusively to the author and do not reflect the views of this platform. This platform and its affiliates disclaim any responsibility for the accuracy or suitability of the information provided. It is for informational purposes only and not intended as financial or investment advice.

.png)