ETH Dominance Strengthens: Are Traders Starting to Switch from Bitcoin to Ethereum?
2026-07-06
In recent weeks, discussions about ETH dominance have once again gained traction among crypto traders. Many are asking: Is Ethereum beginning to show signs of a resurgence after being overshadowed by Bitcoin’s dominance for so long?
This question is becoming increasingly relevant given that the price of ETH, which had fallen below $1,600, is now beginning to recover.
Key Takeaways
- ETH dominance currently stands at around 9.8%, well below its peak of 17% following the launch of the Ethereum spot ETF in mid-2024.
- Bitcoin dominates the market with a 57–58% share, reflecting a structural shift among investors toward assets considered safer.
- Despite bullish technical signals, there are still many fundamental factors weighing on the ETH/BTC ratio, including ETF inflows and the fragmentation of economic value by Layer 2 solutions.
What Is ETH Dominance and Why Does It Matter?
For those new to the crypto world, understanding ETH dominance is a crucial first step. ETH dominance is the ratio of Ethereum's market capitalization to the total market capitalization of all cryptocurrencies, multiplied by 100%.
For example, if the total crypto market is worth $2.6 trillion and ETH's market cap is around $213 billion, then ETH's dominance is around 8.2%. This figure fluctuates constantly as prices change and new crypto assets enter the market.

(Sumber: Generated-AI image)
Why is this metric important? ETH dominance is a barometer of market sentiment. When ETH dominance rises, it often signals altcoin season—a period when investors begin shifting from Bitcoin to altcoins, including Ethereum. Conversely, when ETH dominance falls, it signals capital rotation back into Bitcoin or spreading to other Layer 1 competitors.
For traders, understanding the ETH dominance chart is as important as understanding the ETH price itself. This helps identify the right time to enter or exit a position, as well as manage portfolio risk.
Read also: Bitcoin in July: Historically, It's Often Rising, But This Time Something's Different
ETH Dominance Rises: What's Really Happening?
So, is it true that ETH dominance has been increasing recently? The answer is: it's not that simple.
Data shows that ETH dominance touched the 17% level in mid-2024, shortly after the launch spot ETF Ethereum. However, since then, the figure has continued to erode, reaching 9.8% in mid-2026.
Factors That Depress ETH Dominance
Bitcoin ETFs Are More Popular with Institutions
Spot Bitcoin ETFs launched in 2024 continue to attract billions of dollars in institutional inflows. Meanwhile, Ethereum ETFs recorded a 17-day streak of outflows in 2026, with BlackRock's ETHA leading the outflows at $13.1 million. While there were small inflows in early July 2026—$14.9 million on July 1 and $29 million on July 2—all came from a single asset manager: BlackRock. This does not signal a structural reversal, but rather simply "noise" amidst a bearish trend.
There is no "Treasury Effect" for Ethereum
Unlike Bitcoin, which is being held by companies like Strategy (formerly MicroStrategy) as a treasury reserve, Ethereum does not yet have large-scale institutional accumulation to act as a long-term price buffer.
Layer 2 Reduces Mainnet Economic Value
Layer 2 ecosystems like Arbitrum, Base, and Optimism do increase transaction efficiency, but they also reduce fees flowing to the Ethereum mainnet. This undermines Ethereum's "ultrasound money" narrative as the amount of ETH burned decreases. Michael Saylor even calls this fragmentation of economic value one of Ethereum's biggest challenges.
High Correlation with Nasdaq
ETH has a correlation of 0.78 with the Nasdaq 100, significantly higher than Bitcoin's 0.55. When the tech stock market declines, ETH tends to fall further.
There Has Been No Major Upgrade on Mainnet
The Glamsterdam upgrade, scheduled for late August 2026—targeting 10,000 TPS and a 78% reduction in gas fees—is still in development and has not yet reached mainnet. Until this major upgrade is realized, Ethereum will struggle to compete with Bitcoin's "digital gold" narrative.
Read also: June 2026 Inflation at 3.34%, Exceeding Estimates: What Impact Will This Have on Society?
ETH Dominance Chart: Reading Signals from the Chart
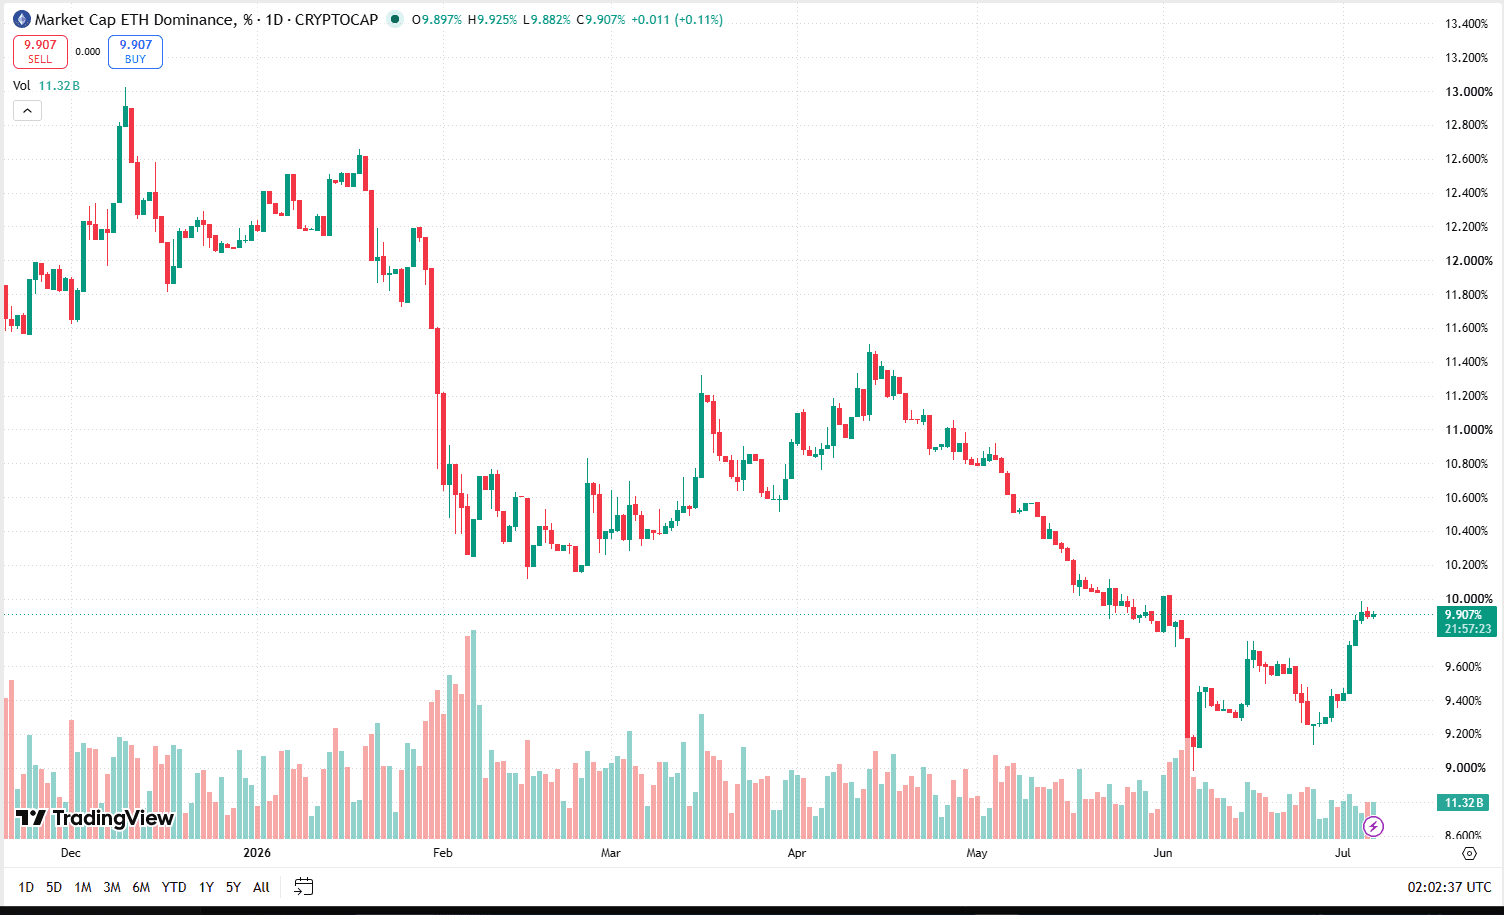
For traders who rely on technical analysis, the ETH dominance chart provides valuable clues about the market's future direction.
Key Levels to Watch Out For
- Support at 9.5%: If ETH dominance is able to hold above this level, there is a chance of a rebound towards the next resistance.
- Resistance at 11-13%: To truly call "ETH dominance strengthening," Ethereum needs to break through this level. According to some analysts, the ETH/BTC pair needs to reach 11% dominance to reverse the structural trend.
- Long-term target 17%: This is a historical support level that was the foundation of ETH dominance before being eroded.
Technical Signals Emerging
Interestingly, despite ETH's dominance being under pressure, several technical indicators are actually pointing to a potential reversal. The ETH/BTC ratio, which briefly touched 0.026—the same level at which a buy signal was issued in the past—is now attracting analyst attention.
Analyst Michaël van de Poppe has suggested that ETH's downtrend may be over, with a key level at 0.026 against BTC.
More interestingly, the TD Sequential indicator on the monthly timeframe has flashed a buy signal—the same signal that appeared in September 2022 and March 2025, which were then followed by ETH rallies of 235% and 182%.
Read also: CROSS Token Distribution July 4th: Is This Coin Finally Legit?
ETH vs BTC Dominance: The Inevitable Comparison
No discussion of ETH dominance would be complete without comparing it to BTC dominance. These two metrics move like two sides of a coin—when one rises, the other tends to fall.
Current State of ETH vs BTC
- Bitcoin dominance: 57.8% (as of July 2026)
- Ethereum dominance: 9.8% (as of July 2026)
- ETH/BTC ratio: 0.02737 (10-month low)
This gap is the widest in years. This comparison shows that for every $100 invested in the crypto market, nearly $58 goes into Bitcoin, while only about $10 goes into Ethereum.
Read also: US Stock Tokenization: Hold Your Favorite US Stocks and Earn 7% Daily
Why Do Traders Switch (or Not Switch)?
The big question in the title of this article is: "Are Traders Starting to Switch from Bitcoin to Ethereum?"
The answer: not yet significant.
Data shows that capital flows are still more directed towards BTC compared to other crypto assets, including ETH. However, several factors could be catalysts for change:
- Bullish Technical Signal: A rare buy signal has appeared on the monthly timeframe
- Glamsterdam Upgrade: Target of 10,000 TPS and a 78% reduction in gas fees scheduled for August 2026
- Increased On-Chain Activity: New smart contract deployments on Ethereum have increased by 303% compared to the 90-day average
- Accumulated Short Positions: With a large number of short positions in the $1,500 range, the conditions for a short squeeze are beginning to take shape
Amid these ever-changing dynamics between ETH and BTC, having access to up-to-date information and the right trading platform is key. To monitor changes in ETH dominance and the price of ETH, as well as to gain the latest market insights, you can rely on Bittime.
As a cryptocurrency trading platform that is officially registered and regulated by the Financial Services Authority (OJK), Bittime not only offers security and convenience in trading but also provides access to a wide range of digital assets, digital precious metals, and tokenized global stocks.
With over 300 coin options and 380 trading pairs, Bittime is the perfect place to start or expand your crypto investment journey.
Read also: Long-Term US Stock Investments 2026: 5 Growth Stocks with High Prospects & Profits!
ETH Price: Is $2,000 Still Affordable?
Of course, any discussion of ETH dominance cannot be separated from its price. At the time of writing, ETH is trading around $1,750, up slightly by 0.53% in the past 24 hours. This price is still far from the psychological $2,000 level, which it briefly lost earlier this year.
Bullish Scenario
If ETH's dominance truly strengthens and breaks through the 11% resistance, some analysts predict ETH could target the $2,000 level. Standard Chartered even maintains its view that ETH could reach $4,000 by the end of 2026. However, it's important to remember that this prediction comes amidst high market uncertainty.
Bearish Scenario
On the other hand, if ETH dominance continues to come under pressure, the price of ETH risks testing support at $1,700 and even $1,400–$1,530. The ETH/BTC ratio, which remains below the 200-week moving average at 0.048, indicates that pressure on ETH remains significant.
For traders who want to monitor changes in ETH dominance and the ETH price in real time, various platforms are available, such as TradingView (with the ticker ETH.D), CoinMarketCap, and CoinGecko.
Read also: Palantir and Nvidia's New Partnership Focuses on Enterprise AI, What Does It Mean?
What Does ETH Dominance Mean for Your Portfolio?
Understanding ETH dominance is not just an academic exercise—it is a practical tool for portfolio management.
When ETH Dominance Rises
- Signal: Altcoin season may be coming
- Action: Consider adding exposure to ETH and selected altcoins
- Risk: Don't get carried away by the euphoria; make sure the increase is supported by fundamentals.
When ETH Dominance Drops
- Signal: Bitcoin is still king; altcoins underperform
- Action: Focus on Bitcoin or stablecoins; reduce altcoin exposure
- Risk: Don't panic sell; the trend could reverse at any time.
Strategies That Can Be Applied
- Dollar Cost Averaging (DCA): Gradually accumulate ETH at support levels
- Monitor the ETH/BTC Ratio: If the ratio approaches historical lows, this could be an attractive accumulation area.
- Diversification: Don't putting all your eggs in one basket—both Bitcoin and Ethereum have different use cases
Conclusion: ETH Dominance Strengthens—Mitosis or Just Hope?
After reviewing various data and analyses, we can draw several conclusions:
First, in terms of numbers, ETH dominance has not yet shown significant strengthening. The figure of 9.8% is still well below the 17% level it once reached. The gap with Bitcoin dominance, which stands at 57–58%, is the widest it has been in several years.
Second, there are some interesting technical signals—ranging from the ETH/BTC ratio at the critical level of 0.026 to the TD Sequential indicator emitting a rare buy signal on the monthly timeframe. This suggests that a potential reversal does exist, but it has not yet been confirmed.
Third, fundamental factors still weigh heavily against Ethereum. The ETF flow, which remains dominated by Bitcoin, value fragmentation caused by Layer 2 solutions, and the lack of major upgrades are structural obstacles that cannot be ignored.
So, are traders starting to shift from Bitcoin to Ethereum? The answer: not on a massive scale yet. However, for astute traders, the current conditions may offer attractive accumulation opportunities—provided, of course, that risks are managed wisely.

Bittime is a licensed and regulated Digital Financial Asset Trader (PAKD) supervised by Indonesia’s Financial Services Authority (OJK) — where you can buy Bitcoin in Indonesia and hundreds of other crypto assets starting from just Rp10,000. The registration process is fast, secure, and you can get started today.
Track USDT to IDR conversions and monitor your favorite crypto assets in real time. Everything is available in one crypto investment app that you can download for free on the Play Store
Ready to start? Register now on Bittime and execute your investment strategy with a platform trusted by millions of users in Indonesia.
FAQ
What is ETH dominance?
ETH dominance is the percentage of Ethereum's market capitalization to the total market capitalization of all crypto assets. This metric is calculated by dividing ETH's market capitalization by the total crypto market capitalization and then multiplying by 100%.
Why is ETH dominance important for traders?
ETH dominance helps traders identify capital flow direction and market sentiment. A rise in ETH dominance often signals an altcoin season, while a decline signals a preference for Bitcoin or other Layer 1 competitors.
Will ETH dominance really strengthen in 2026?
Data shows that ETH dominance actually decreased from 17% (mid-2024) to around 9.8% in mid-2026. Despite bullish technical signals, ETH remains fundamentally under pressure.
What is the difference between ETH dominance and BTC dominance?
ETH dominance measures Ethereum's market share, while BTC dominance measures Bitcoin's market share. Both are competitive metrics—when BTC dominance rises, ETH dominance tends to fall, and vice versa.
How to view ETH dominance chart?
The ETH dominance chart can be accessed through platforms like TradingView (ticker ETH.D), CoinMarketCap, and CoinGecko. This chart displays the movement of Ethereum's market share over time.
Disclaimer: The views expressed belong exclusively to the author and do not reflect the views of this platform. This platform and its affiliates disclaim any responsibility for the accuracy or suitability of the information provided. It is for informational purposes only and not intended as financial or investment advice.

.png)