Gold Crashing? Bearish Breakout Accelerates Price Decline
2026-05-28
Bittime - Gold price Gold (XAU) is currently trading at $4,404, down 1.72% intraday and has lost more than 21% from its peak above $5,600 in February 2026.
Is gold crashing?
The bearish breakdown of the parallel channel on May 15th has accelerated the decline.
Prices are now testing the critical support zone at $4,376. A breakout would open the door to $4,044 and $3,500.
Key Points
Gold price drops to $4,404– Bearish breakdown of the parallel channel. Down 21% from the $5,600 peak.
Key support at $4,376 (0.618 Fibo)– If broken, the next targets are $4,044 and $3,500 (end of 2026).
Bearish technical indicators– 4-hour RSI at 27 (oversold), BBWP expanding from compression zone.
Register at Bittime now and start trading crypto with a fast, safe, and easy process in the app.
Today's Gold Price and Bearish Breakdown
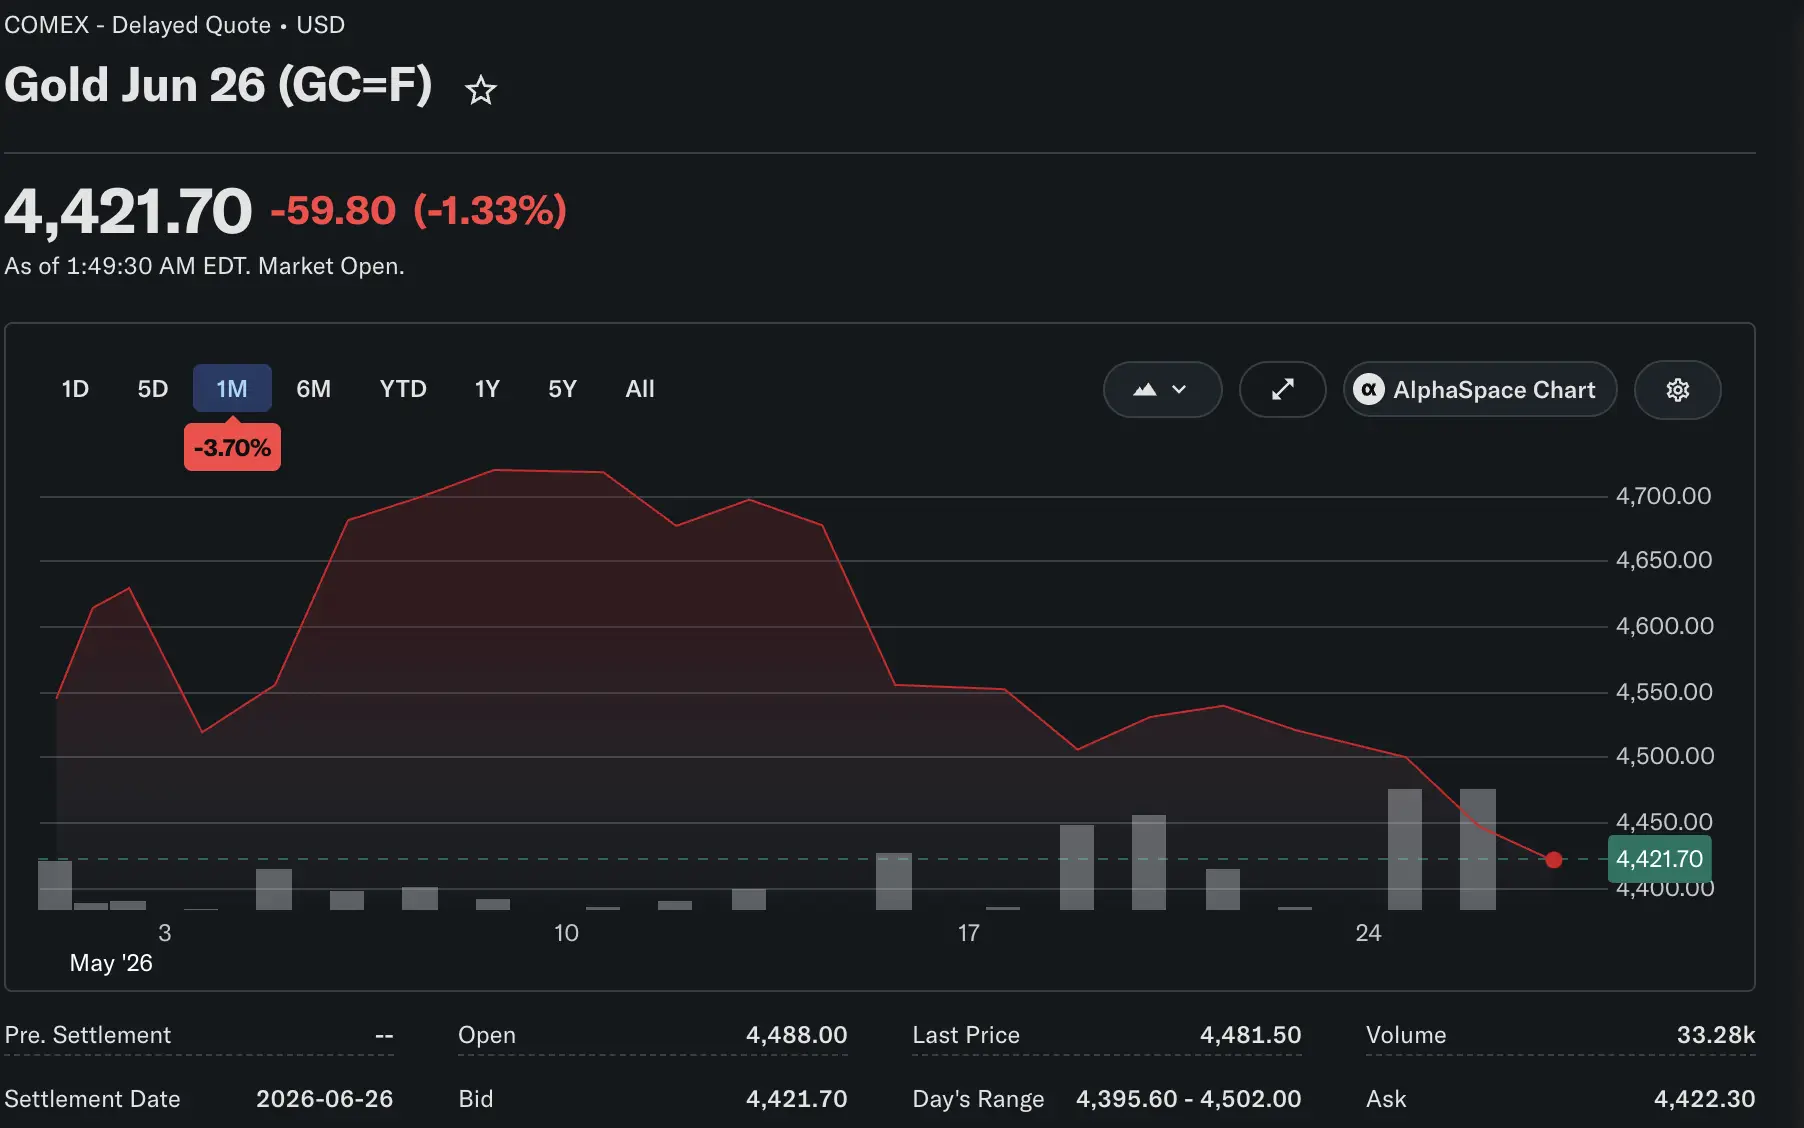
Source: Yahoo Finance
Gold prices for May 2026 were highly volatile. According to Yahoo Finance data, the June 2026 gold contract (GC=F) was at $4,404.30, with a daily range of $4,398-$4,502.
Technically, a bearish breakdown occurred on May 15th when gold lost the lower trendline of the parallel triangle pattern. Since then, the price has continued to decline and is now approaching a key zone.
Gold technical analysis shows that this breakdown is not an ordinary correction.
This is a continuation of the bearish trend that has been going on since February.
Check out how to buy digital gold like Pax Gold (PAXG) on Bittime!
Technical Analysis: Channels and Fibonacci
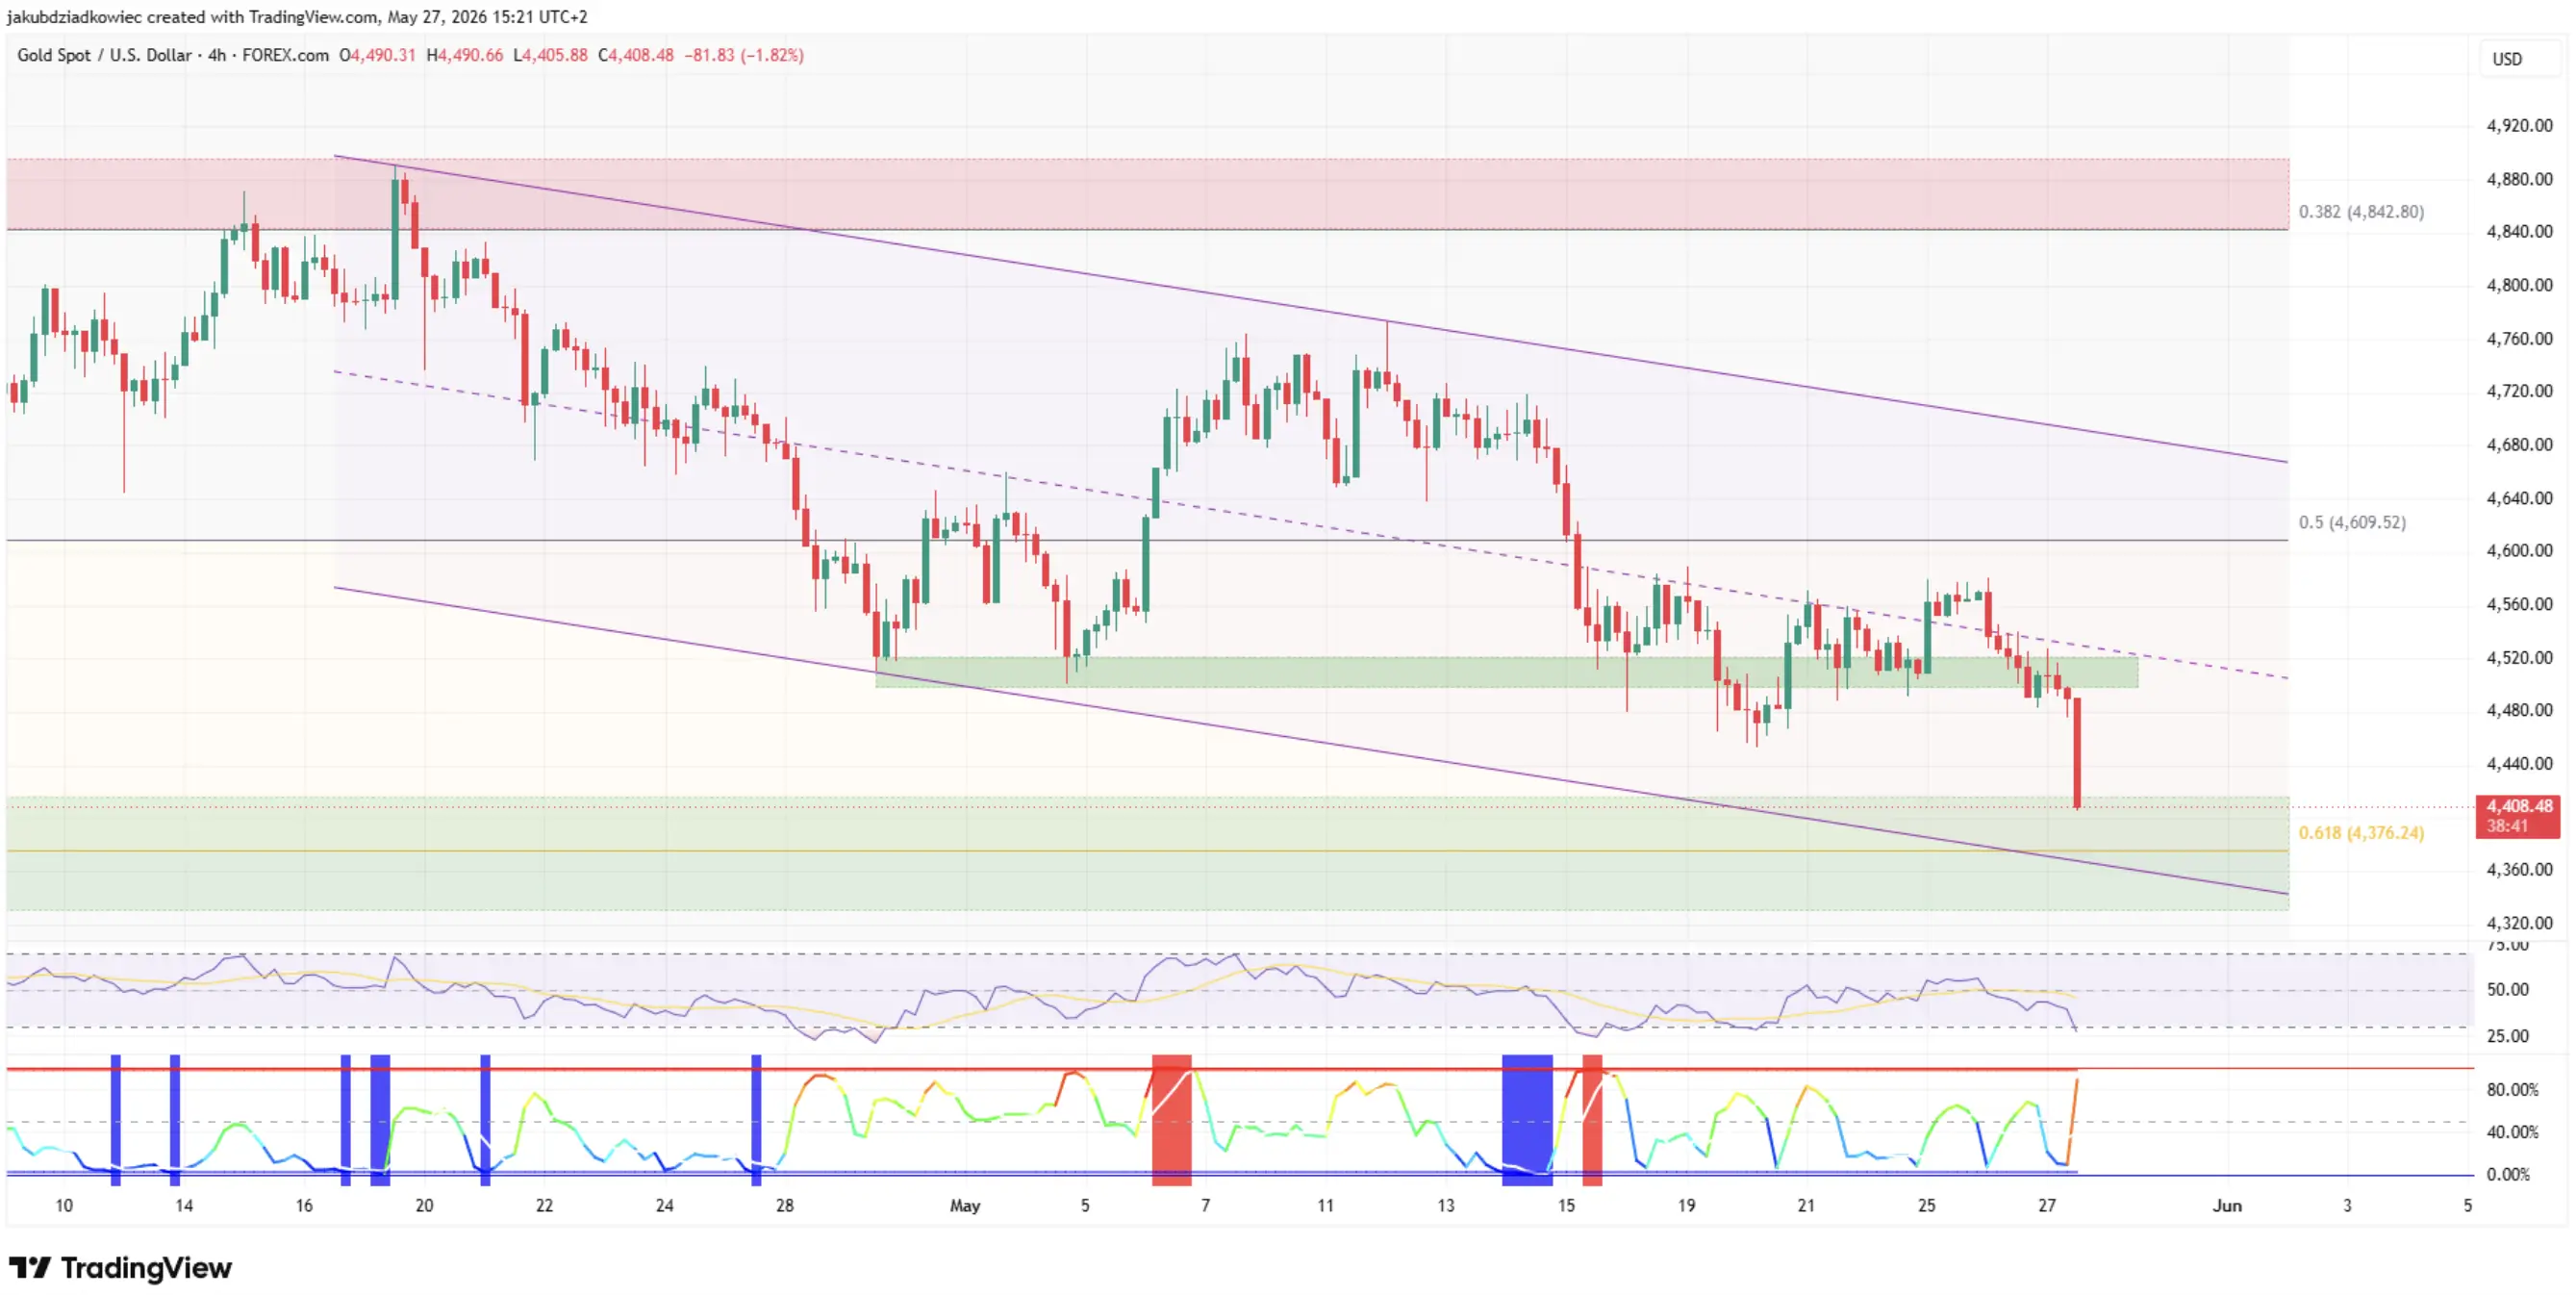
On the 4-hour timeframe, gold has slipped below the midline of the descending parallel channel.
Price is now trading near the lower boundary of the channel, just above the 0.618 Fibonacci retracement level at $4,376.
The 4-hour RSI has fallen to 27, entering oversold territory. Meanwhile, the Bollinger Band Width Percentile (BBWP) is in the extreme volatility zone.
Historically, expansion from such a compression zone has tended to result in continuation, not reversal.
The gold Fibonacci retracement from peak to low shows key levels:
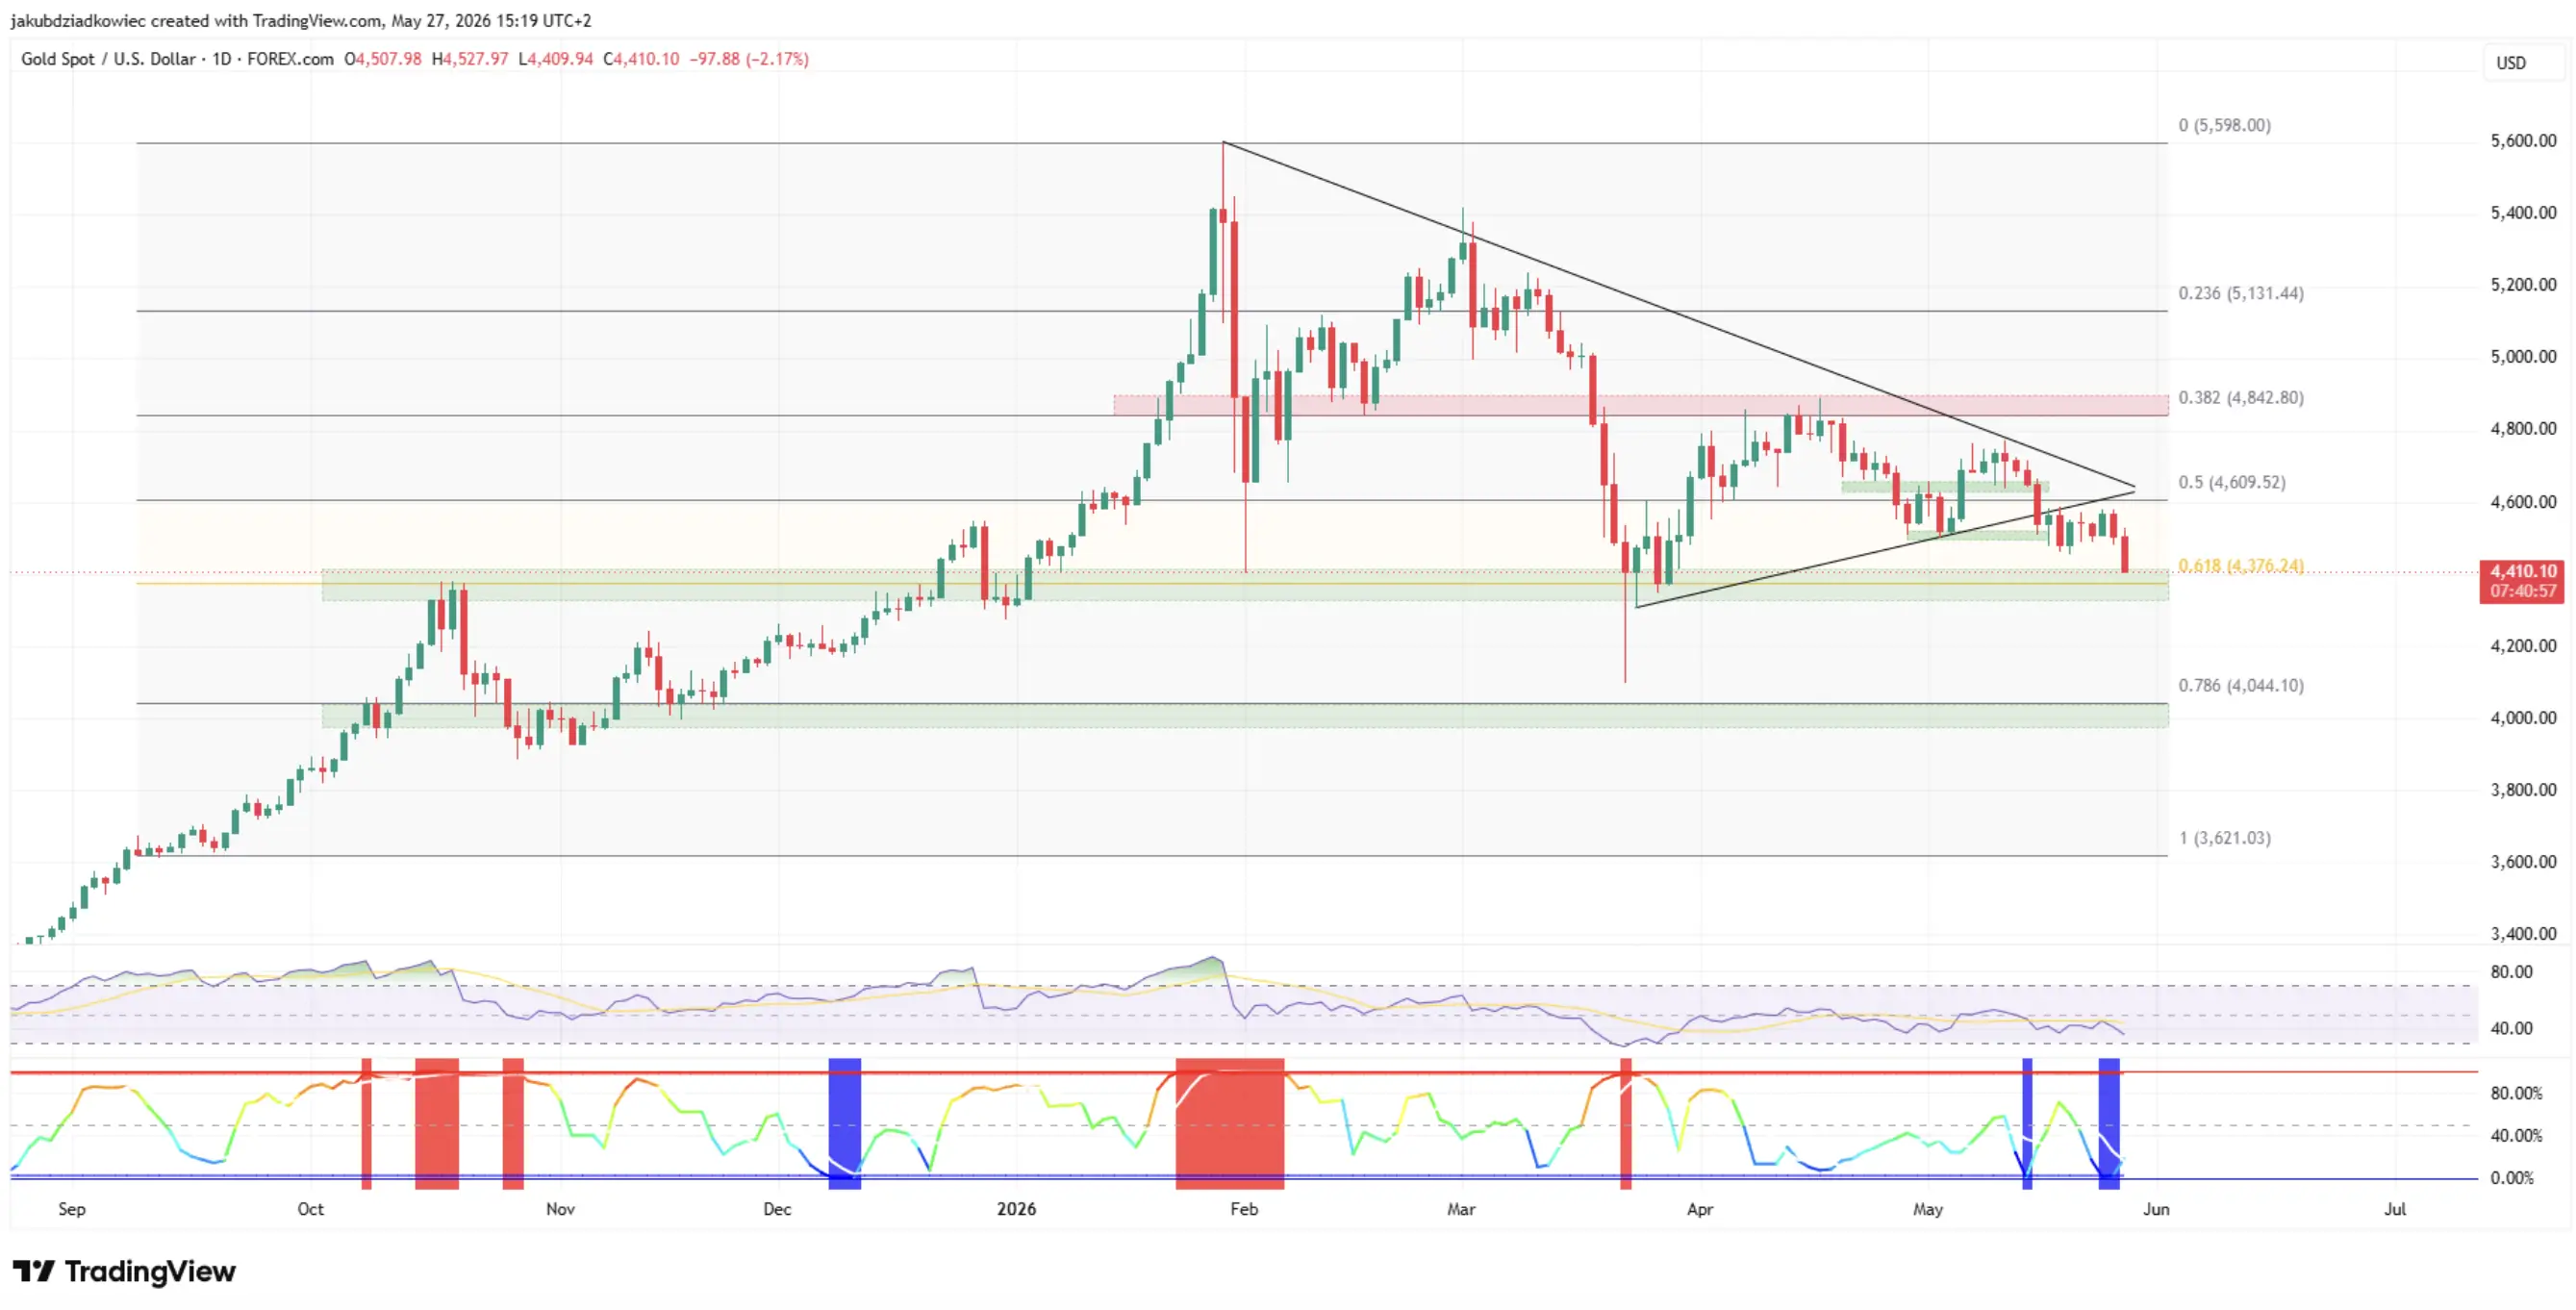
- 0.382 Fibo: $4.842 (resistance)
- 0.5 Fibo:$4.609 (channel midline)
- 0.618 Fibonacci:$4,376 (current key support)
- 0.786 Fibonacci:$4,044 (next target)
Support Gold $4.376:Crucial Point
Gold's $4,376 support level is the most important level right now. This level represents the 0.618 Fibonacci retracement level of gold's entire previous rally.
If this support holds, a potential rebound is towards the nearest resistance at $4,609 (the channel's midline).
A deeper rebound could test long-term resistance at $4,842 (0.382 Fibo), a level that has served as a ceiling every time the price has attempted a recovery since the February peak.
If the $4,376 support breaks, the path to the next target is open:
- Direct targets:$4,044 (0.786 Fibonacci)
- Long term targets:$3,500 (end of 2026 prediction)
X analyst @CelalKucuker projects gold could reach $3,500 by the end of 2026. This projection aligns with the bearish picture on the long-term chart.
Read also:Gold Prediction 2026: XAU Breaks $5,000, Major Banks Raise Target to $6,600
Additional Technical Indicators
The bearish gold outlook for 2026 is also confirmed by other indicators. The daily RSI is at 36, still above the oversold zone.
This leaves room for further declines without triggering a mean-reversion rebound. In other words, gold could still fall further before becoming truly oversold on the daily timeframe.
BBWP on the daily chart has just started expanding after weeks of compression in the very low blue zone.
Historically, volatility breakouts from compressed conditions tend to extend trends, not reverse them.
Short-term gold price prediction: the decline will continue as long as the price remains below $4,609 (channel midline).
Recovery will only occur if gold can reclaim that level.
Track the price of Gold Digital like Pax Gold (PAXG) directly on Bittime!
What Causes Gold to Fall?
Several factors drive gold bearish 2026
1. The Fed's high interest rate expectations. Positive real interest rates increase the opportunity cost of holding non-yielding gold.
2. Strengthening of the US dollar. A strong dollar tends to depress commodity prices, including gold.
3. Geopolitical developments. The US-Iran peace issue has reduced demand for safe havens.
4. Profit-taking after a long rally. Gold rose from $2,000 to $5,600 in two years, and a correction is natural.
Convert 1 IDR to XAUT - Indonesian Rupiah Exchange Rate
Conclusion
Is gold crashing? Gold prices fell to $4,404, with a bearish breakdown from the parallel channel accelerating the decline. Gold's support level of 4376 (0.618 Fib) is the level that will determine the next direction.
Gold technical analysis shows bearish indicators: oversold RSI on 4-hour, BBWP expansion, and price below channel midline.
Gold price prediction:If $4,376 breaks, targets of $4,044 and $3,500 (end of 2026) are open.
Gold moved above $4,400 in May 2026, but bearish momentum remains dominant. Volatile gold prices will continue to trend downward in 2026.

Now that you know today’s Antam gold price, Bittime also offers digital gold assets like XAUT and PAXG for hassle-free gold investing!
Bittime is a licensed and regulated Digital Financial Asset Trader (PAKD) supervised by Indonesia’s Financial Services Authority (OJK) — where you can buy Bitcoin in Indonesia and hundreds of other crypto assets starting from just Rp10,000. The registration process is fast, secure, and you can get started today.
Track USDT to IDR conversions and monitor your favorite crypto assets in real time. Everything is available in one crypto investment app that you can download for free on the Play Store
Ready to start? Register now on Bittime and execute your investment strategy with a platform trusted by millions of users in Indonesia.
FAQ
Is gold crashing?
Gold prices fell 21% from a peak of $5,600 and broke down bearishly. This was a significant correction, heading in a bearish direction.
What is the price of gold today?
$4,404.30 (June 2026 contract), down 1.72% in a day.
What is the support for gold 4376?
The 0.618 Fibonacci retracement level acts as key support. If it breaks, the next target is $4,044.
What is the short-term gold price prediction target?
If the $4,376 support level breaks, the target is $4,044. If it holds, it could rebound to $4,609-$4,842.
What are the current technical indicators for gold?
4-hour RSI at 27 (oversold), BBWP expanding from compression zone, price below channel midline.
Disclaimer: The views expressed belong exclusively to the author and do not reflect the views of this platform. This platform and its affiliates disclaim any responsibility for the accuracy or suitability of the information provided. It is for informational purposes only and not intended as financial or investment advice.

.png)