Double Bottom Pattern: Trend Reversal Signals and Technical Analysis Strategies Every Trader Should Know
2025-10-08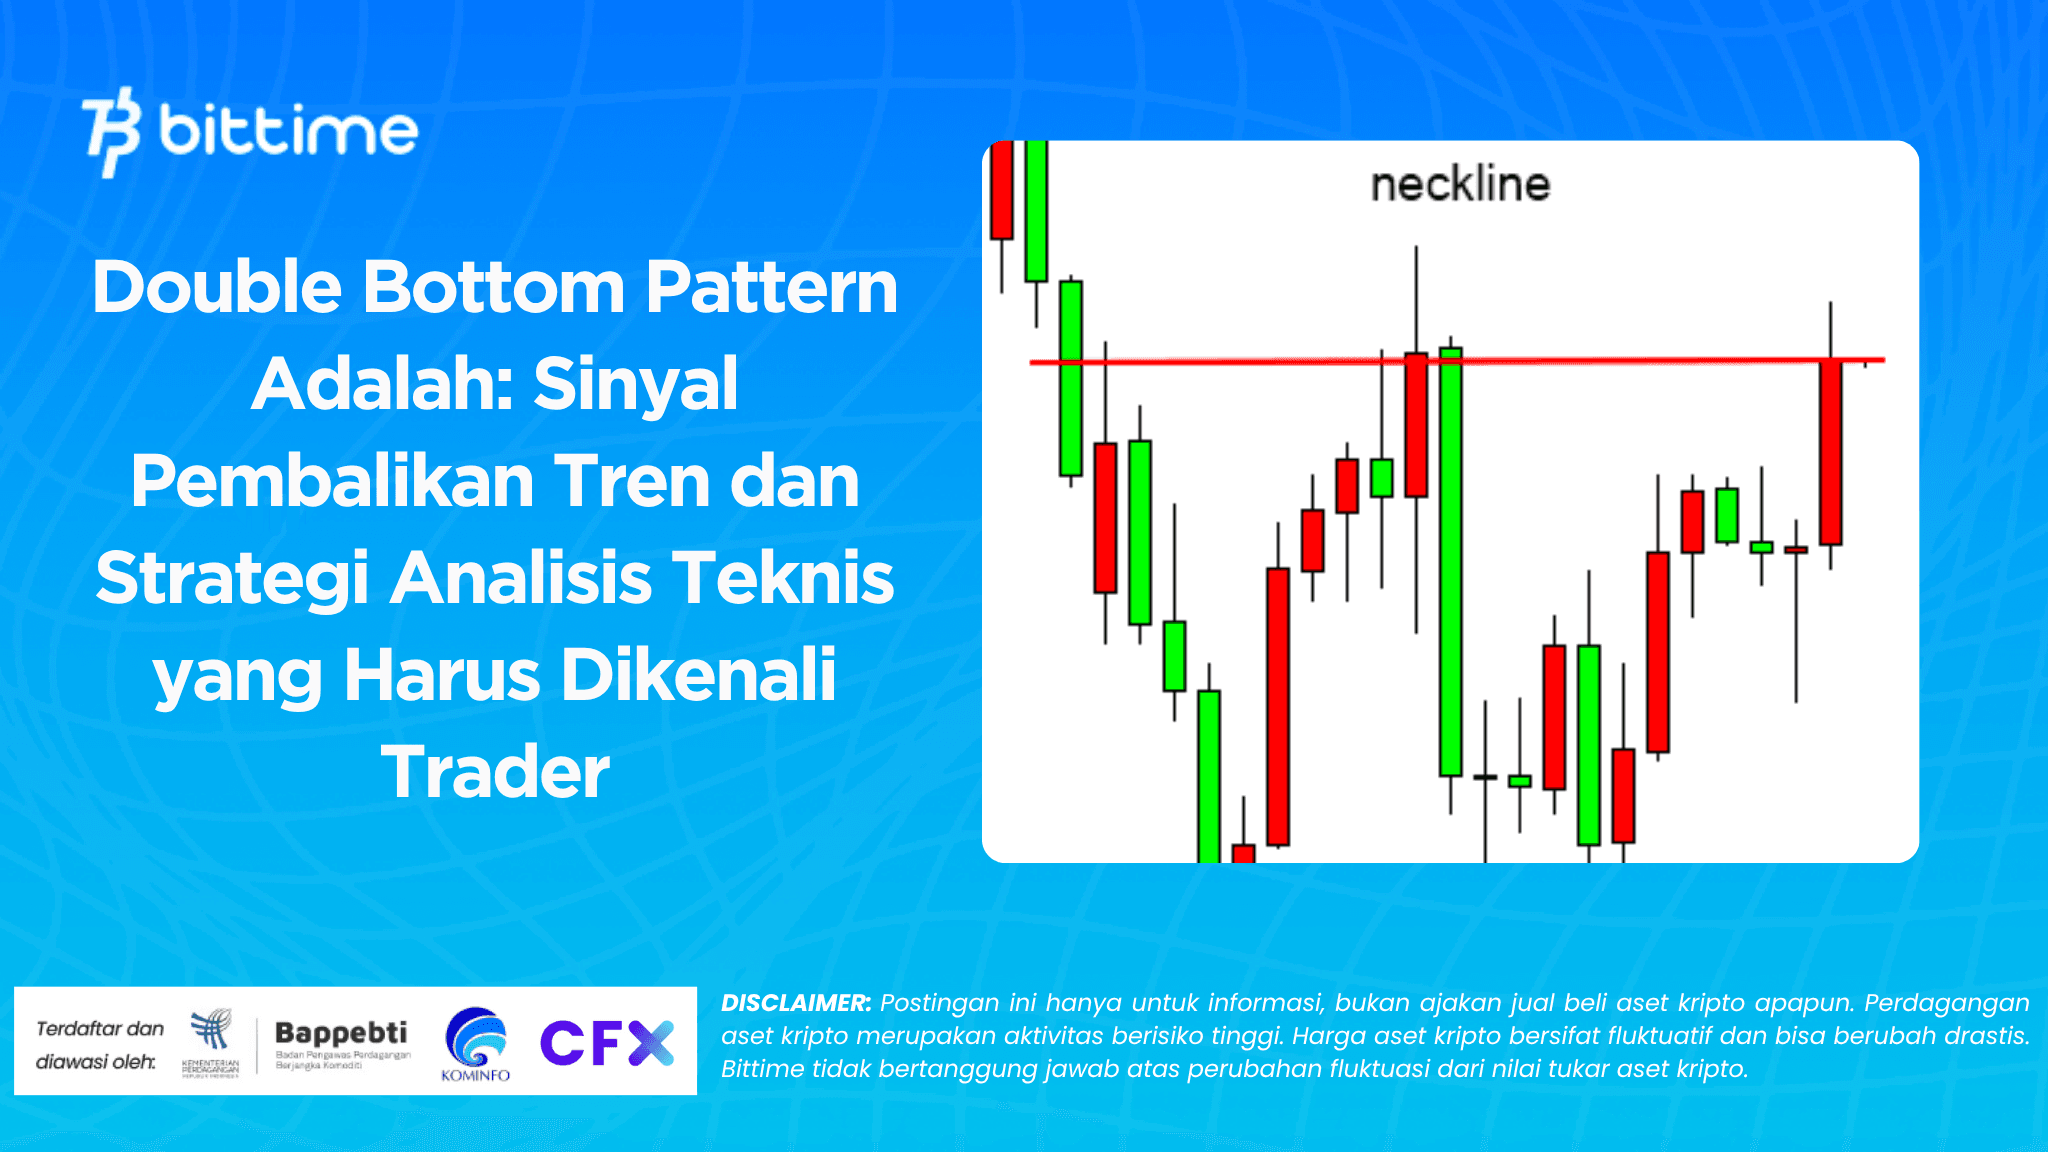
Bittime - In the world of technical analysis, understanding the double bottom pattern is crucial for any trader looking to identify market reversal moments. This pattern often appears after a prolonged period of price decline and signals a bearish trend is weakening.
Visually, a double bottom pattern forms a “W”-like pattern — where the price experiences two declines to nearly the same level, before finally rebounding and signaling a potential new uptrend.
For analysts and investors, understanding this pattern can be a strategic step in determining optimal buying points and predicting the next market momentum.
Source: Axi
What is a Double Bottom Pattern?
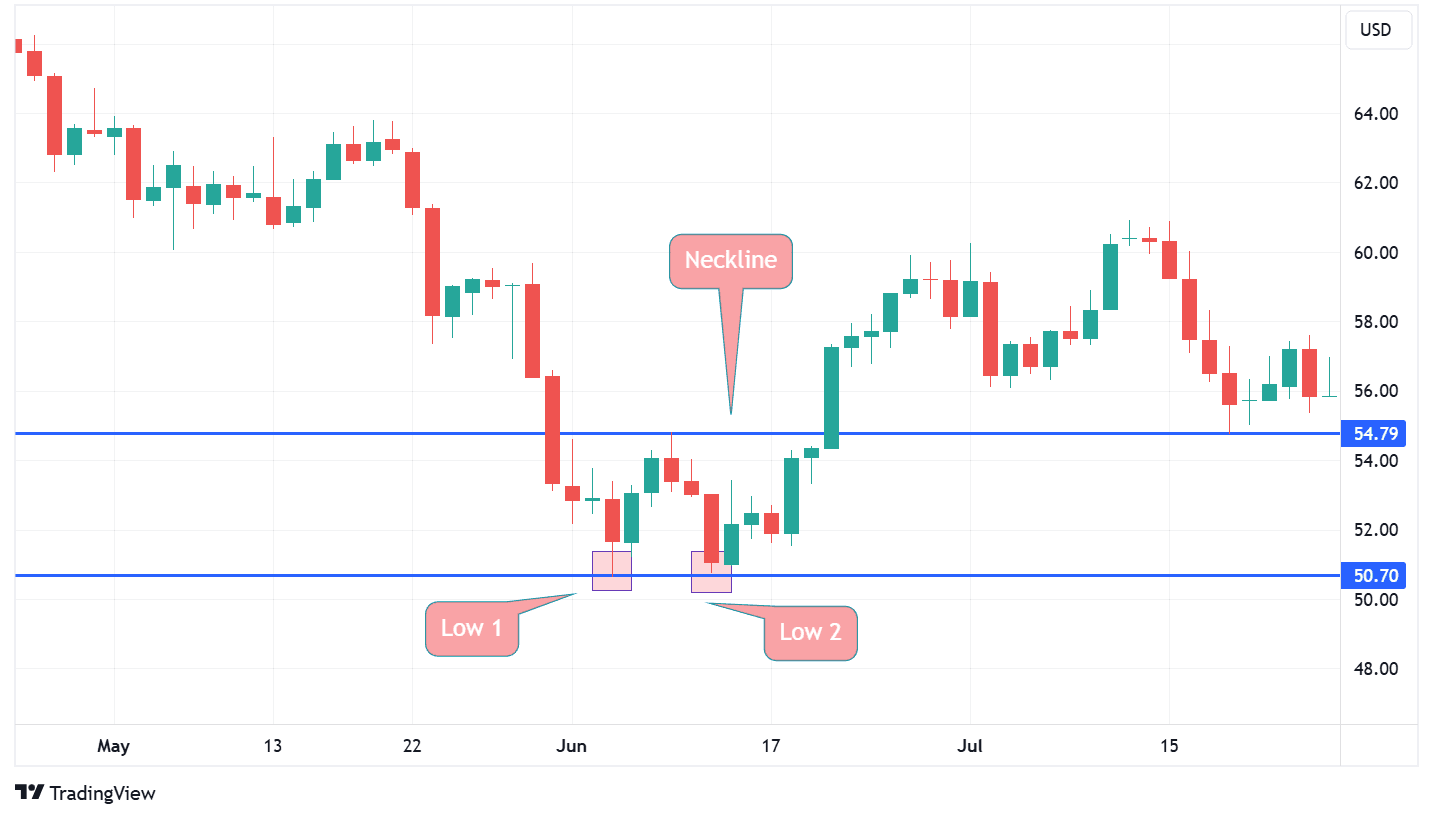
Simply put, a double bottom pattern is a reversal pattern that indicates a trend shift from bearish to bullish. This pattern forms when the price of an asset:
Go down to the lowest point (first bottom)
Bouncing up temporarily
Then it goes back down to near the previous lowest level (second bottom)
And finally rose through the peak level between the two bases.
This pattern indicates that selling pressure is easing and buying momentum is taking over. In many cases, this formation signals the beginning of a new uptrend.
Characteristics and Validation of the Double Bottom Pattern
In order for this pattern to be considered valid, several technical indicators need to be taken into account:
Two bottom pointsshould be within 3%–4% of each other.
Trading volumetends to increase when the price bounces off the second bottom.
Pattern confirmationoccurs when the price manages to break through the peak in the middle of the “W” formation.
Traders often use daily or weekly data to accurately identify these patterns. The longer the time interval between two base points, the stronger the reversal signal generated.
How to Read and Use Double Bottoms in Trading
In practice, the double bottom pattern often forms the basis for entry position decisions. Here are the general steps traders follow:
Observe two base points with sufficient time interval.
Wait for confirmation of a breakout above the “middle high” (the middle peak of the letter W).
Entry a buy position after the daily breakout closes above that level.
Use a stop-loss below the second bottom point to anticipate false signals.
The minimum profit target is usually measured based on the distance between the bottom and the middle peak of the pattern—around a 10%–20% increase from the low. If fundamentals are favorable, the potential upside can be much greater.
READ ALSO: How to Trade Crypto in Indonesia for Beginners: A Complete and Easy Guide
Real-Life Example: Double Bottom Pattern in Stock and Crypto Markets
For example, the double bottom pattern is often seen in major stocks and cryptocurrencies like Bitcoin and Ethereum. For example, when the Bitcoin price experienced two drops to the Rp1.8 billion level, but was unable to break lower, it was followed by a surge in volume and a sharp rebound. This situation usually signals strong support and a potential trend reversal to a bullish trend.
For professional traders, observing signals like these means strategic opportunities to enter the market before a major rally occurs.
The Relationship Between Double Bottom Pattern and FDI According to Purbaya
According to economic research by Purbaya (2020), foreign direct investment (FDI) flows significantly influence the stability of financial markets, including the stock market. When foreign investment increases, investor confidence in economic conditions also increases—strengthening fundamentals that can support technical patterns like double bottoms.
In other words, the formation of a double bottom pattern is often not only a result of market psychology, but also a reflection of improvements in macro fundamentals, including the inflow of foreign capital.
READ ALSO: 7 Effective Crypto Trading Methods for Beginners, Complete with Tips and Tricks
Conclusion
The double bottom pattern is one of the most important technical formations in market analysis. This pattern not only marks the end of a downtrend but also signals the beginning of a potential long-term uptrend.
By paying attention to volume, breakout confirmation, and macro conditions such as FDI flows, traders can leverage this pattern as a strategy to take smarter and more profitable positions.
How to Buy Crypto on Bittime

Want to trade sell buy BitcoinsLooking for easy crypto investing? Bittime is here to help! As an Indonesian crypto exchange officially registered with Bappebti, Bittime ensures every transaction is secure and fast.
Start by registering and verifying your identity, then make a minimum deposit of IDR 10,000. After that, you can immediately purchase your favorite digital assets!
Check the course BTC to IDR, ETH to IDR, SOL to IDRand other crypto assets to find out today's crypto market trends in real-time on Bittime.
Additionally, visitBittime Blogto get various interesting updates and educational information about the world of crypto. Find trusted articles on Web3, blockchain technology, and digital asset investment tips designed to enrich your crypto knowledge.
FAQ
What is a double bottom pattern?
The trend reversal pattern is in the shape of the letter "W" which indicates the potential price increase.
How to recognize a double bottom pattern?
Look for two base points 3%–4% apart and make sure there is an increase in volume during the rebound.
Is the double bottom always accurate?
Not always, it is necessary to confirm a breakout above the middle peak level before entry.
What is the profit target of this pattern?
Typically 10%–20% of the distance between the base and the middle peak of the pattern.
What does FDI have to do with double bottom?
Increased FDI can strengthen economic fundamentals, supporting the validity of trend reversal signals.
Disclaimer: The views expressed belong exclusively to the author and do not reflect the views of this platform. This platform and its affiliates disclaim any responsibility for the accuracy or suitability of the information provided. It is for informational purposes only and not intended as financial or investment advice.

.png)