How to Use Fibonacci Retracement: A Complete Guide for Traders
2025-10-07
In the world of trading, whether in the crypto, stock, forex, or commodity markets, there is one technical analysis tool that is often called the "secret" of professional traders, namelyFibonacci Retracement.
This indicator is used to identify potential price reversals and determine support and resistance areas.
This article will discuss how to use Fibonacci Retracement, especially for those of you who want to improve the accuracy of your market analysis. Read this article to learn more!
What is Fibonacci Retracement and its Function
Fibonacci Retracement is a technical analysis tool based on mathematical ratios from the Fibonacci sequence. These ratios are often used to map potential price reversal areas within a trend.
The most frequently used Fibonacci numbers are23.6%, 38.2%, 50%, 61.8%, and 78.6%In trading, these levels help traders find potential areas where prices can pause, bounce, or turn around.
The Fibonacci Retracement function is not only to predict support and resistance levels, but also helps traders:
- Determine the entry point and exit point.
- Manage risks better.
- Determine the take profit area.
Read Also: What is a Triple Top Pattern? How to Read It and Use Trading Strategies
How to Use Fibonacci Retracement
Fibonacci Retracement can be applied to various instruments, starting from stocks, crypto, to forexThe principle of use remains the same: draw a line from the highest point (swing high) to the lowest point (swing low), or vice versa, depending on the direction of the market trend.
Here are the steps how to use Fibonacci retracement what you need to know:
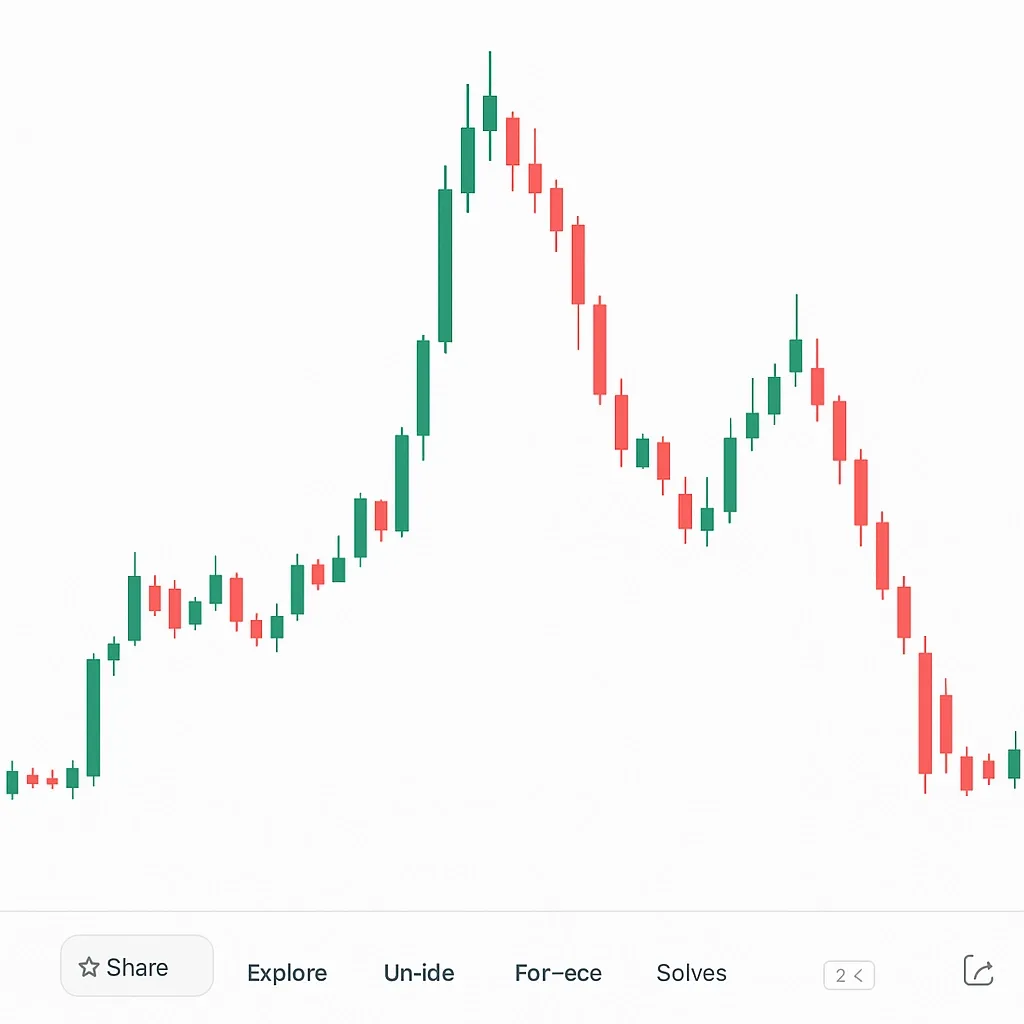
1. Understand the direction of market movement
Source: Trading View
The first step is to determine whether the market is uptrend (up) or downtrend (down).
- If it's going up, you draw a line from the low point (0%) to the high point (100%).
- If it is going down, draw a line from the high point (100%)to the low point (0%).
This way, you can identify areas where the price is likely to correct before continuing its main trend.
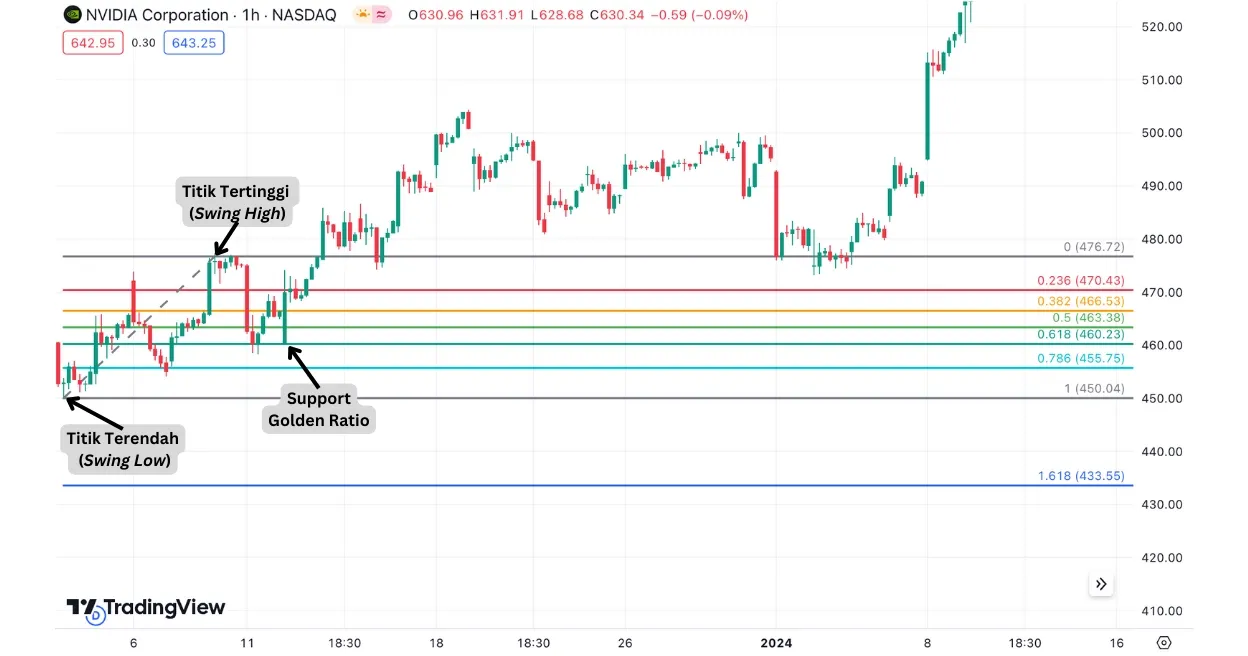
2. Identify Support and Resistance Levels
Source: Trading View
Once the Fibonacci lines are drawn, the chart will display ratio levels such as 23.6%, 38.2%, 50%, 61.8%, up to 78.6%.
- Level support is an area where prices tend to stop falling and bounce up.
- Level resistance is an area where prices don't tend to stop rising and start falling.
Usually, the area 61,8% known as “golden ratio”, which is the level most often used by traders to find potential entry points.
3. Determine Buy and Sell Positions

Source: Trading View
Determining entry and exit positions is very important in Fibonacci strategy.
- For an uptrend: wait for the price to correct to the area between 50%–61,8%, then watch for reversal signs to open a buy position.
- For a downtrend: if the price rises near the area50%–61.8%, it could be a signal to open a sell position.
Use additional indicators such as candlestick pattern or Moving Average to strengthen the signal before making a decision.
Read Also: How to Trade Crypto for Beginners: A Complete and Simple Guide
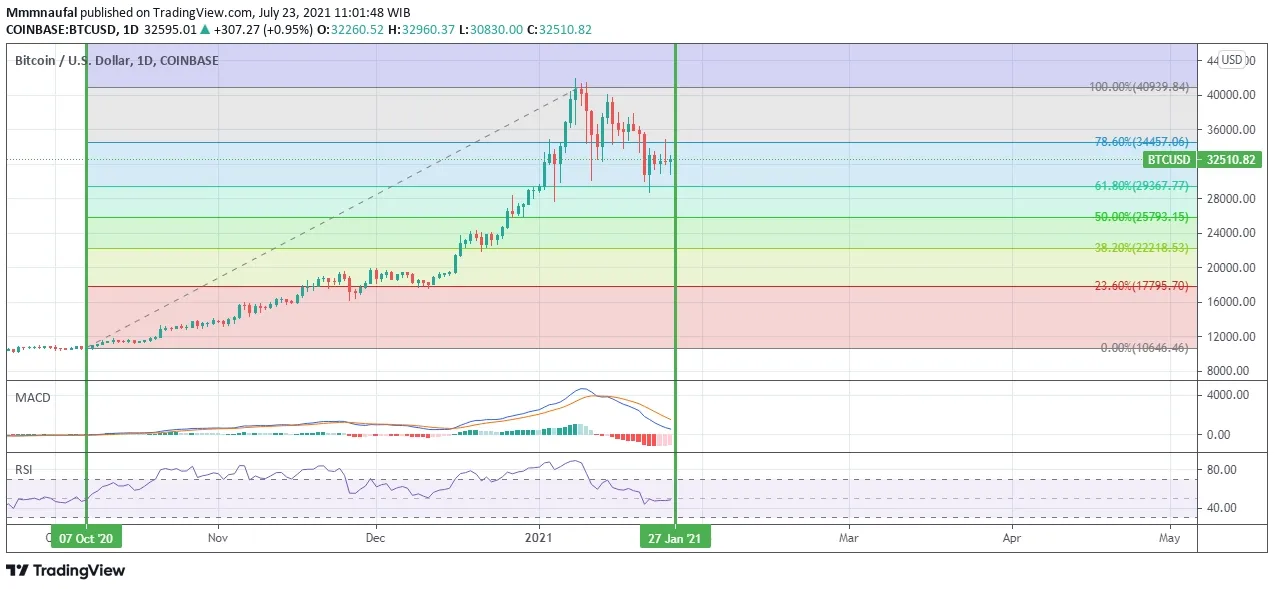
4. Use Fibonacci Extension for Profit Target
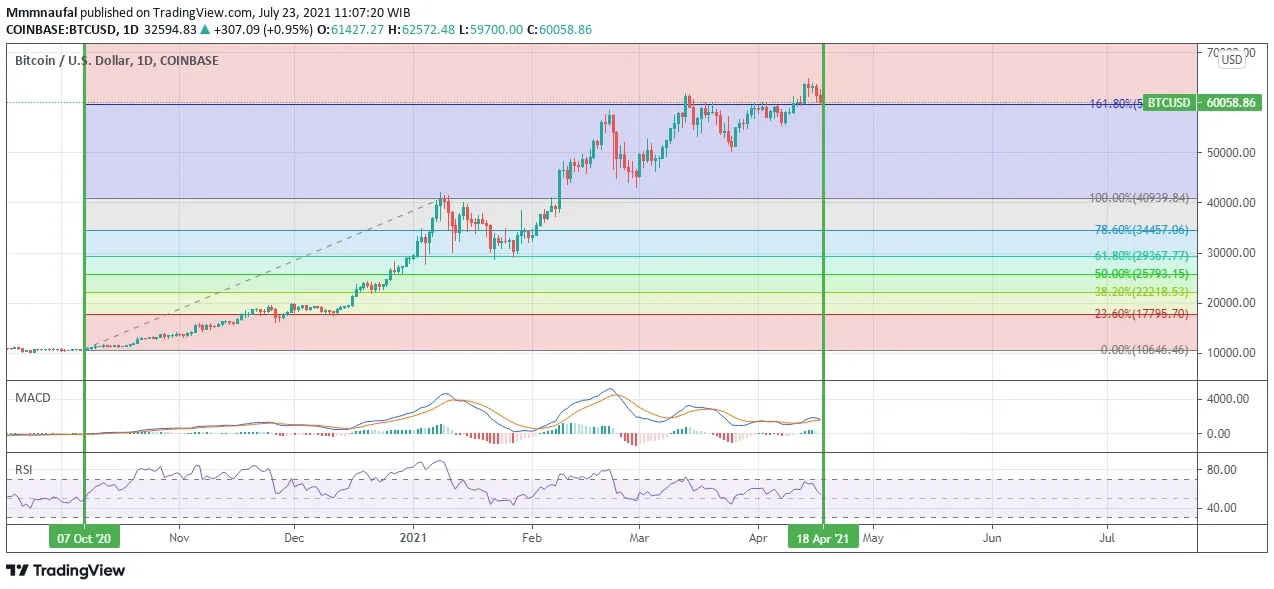
Source: Trading View
Besides Fibonacci retracement, there is also a Fibonacci Extension feature which helps determine the profit target (take profit).
For example, after you draw a retracement line, you can estimate the price target at the level161,8%, which is often the next price level after a breakout.
By calculating from the 100% level and multiplying it by 161.8%, traders can estimate the potential for further price increases.
5. Perform Periodic Reanalysis
Markets are always changing, and technical analysis is not definitive. Once a target is reached, it is best to repeat the analysis from the beginning to adapt strategies to the latest market conditions.
Fibonacci Retracement is only a tool, not a guarantee. Use this indicator in conjunction with other technical analysis such as RSI, MACD, or volume for more accurate results.

Conclusion
Knowing how to use Fibonacci Retracement in trading is an important skill for anyone who wants to better understand price movements.
This indicator will help traders find potential areas to enter and exit the market more precisely.
However, it is important to remember that the indicators not a perfect tool because hThe results of the analysis need to be confirmed with other indicators.
With practice and in-depth understanding, Fibonacci can be a powerful tool for reading market direction and increasing profit opportunities.
Read Also: 5 Best Crypto Education Platforms for Beginners and Traders in 2025
How to Buy Crypto on Bittime
Want to trade sell and buy Bitcoins and easy crypto investing? Bittime is here to help! As an Indonesian crypto exchange officially registered with Bappebti, Bittime ensures every transaction is secure and fast.
Start by registering and verifying your identity, then make a minimum deposit of IDR 10,000. After that, you can immediately purchase your favorite digital assets!
Check the course BTC to IDR, ETH to IDR, SOL to IDR and other crypto assets to find out today's crypto market trends in real-time on Bittime.
Additionally, visit Bittime Blog to get various interesting updates and educational information about the world of crypto. Find trusted articles on Web3, blockchain technology, and digital asset investment tips designed to enrich your crypto knowledge.
FAQ
What is the main function of Fibonacci in trading?
Fibonacci is used to identify support and resistance levels, as well as to estimate price reversal points.
Can Fibonacci be used on all assets?
Yes, this indicator can be used for various assets such as stocks, forex, crypto, and commodities.
What is the difference between Fibonacci Retracement and Extension?
Retracement is used to measure the potential for price correction, while extension is used to estimate price targets after the trend continues.
Why is the 61.8% level called the “golden ratio”?
Because this level is often a key areawhereprices experience a significant trend reversal or continuation.
Can Fibonacci stand alone without other indicators?
Not recommended. Use Fibonacci in conjunction with other indicators such as RSI, MACD, or trendlines to strengthen your analysis.
Disclaimer: The views expressed belong exclusively to the author and do not reflect the views of this platform. This platform and its affiliates disclaim any responsibility for the accuracy or suitability of the information provided. It is for informational purposes only and not intended as financial or investment advice.

.png)