How to Read Candlestick Charts for Beginner Investors
2025-09-09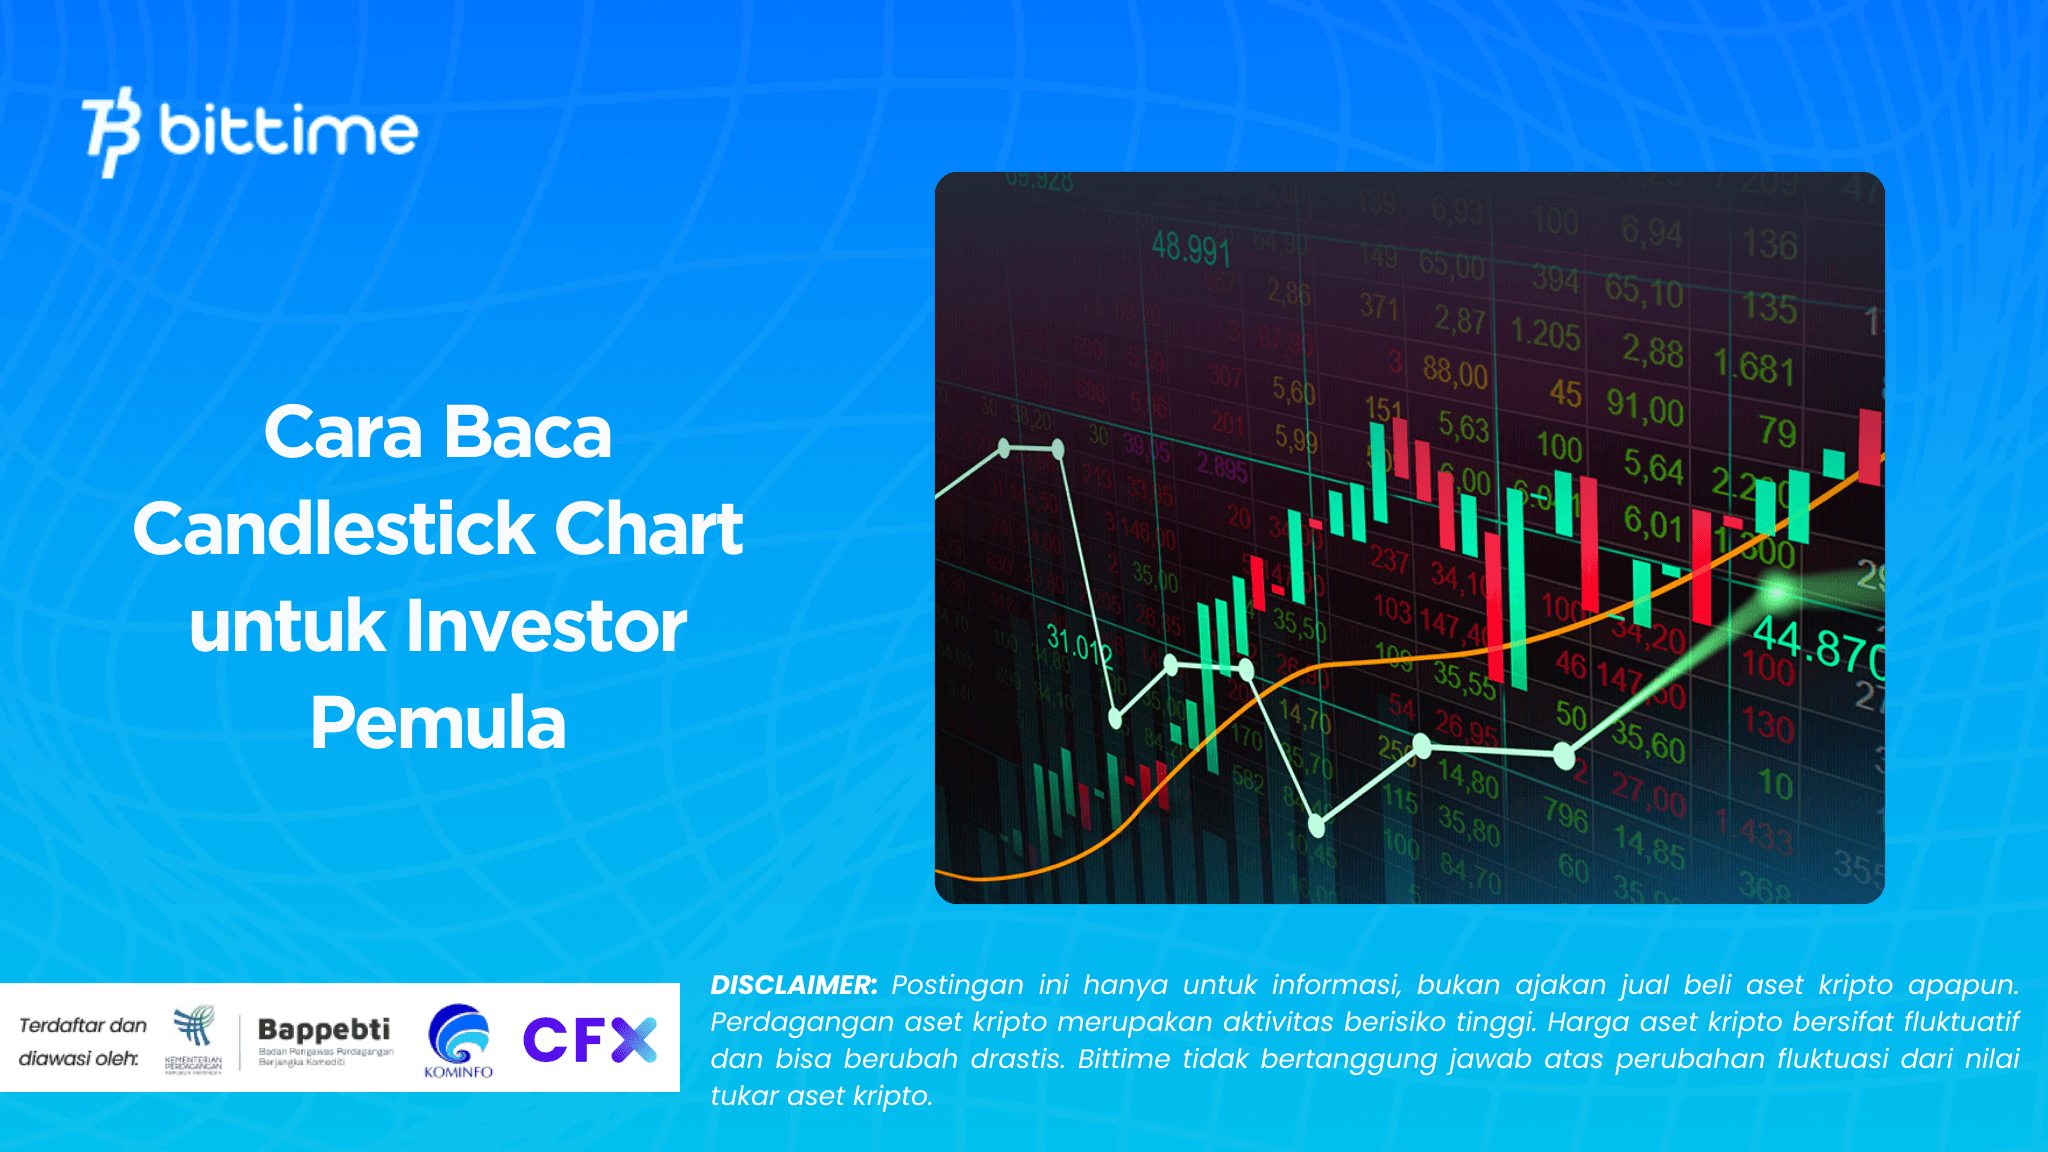
Bittime - In the world of investing, particularly in stock and crypto trading, understanding price charts is a fundamental skill. One of the most popular charts is the candlestick chart.
This chart not only displays price data, but also reflects market psychology—whether the current sentiment is more dominated by buyers (bullish) or sellers (bearish).
For beginner investors, understanding candlestick charts is the first step toward reading market trends, identifying patterns, and making more confident investment decisions.
This article will discuss the meaning of candlestick charts, their important components, and how to read candlestick charts for beginners.
What is a Candlestick Chart?
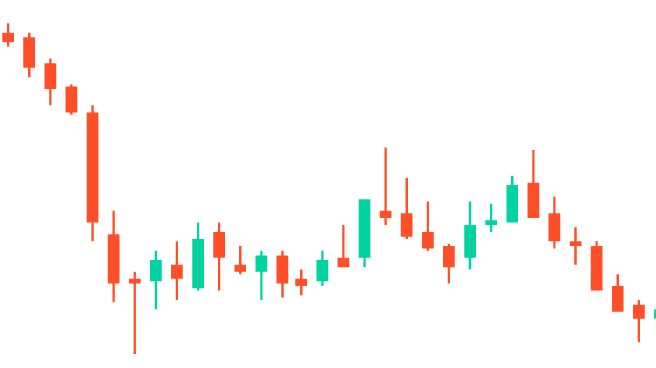
A candlestick chart is a graph that depicts the price movement of an asset over a specific period. This chart displays four key pieces of information in a single candlestick:
- Open (Opening Price)– the asset price when the session starts.
- Close (Closing Price)– the asset price at the end of the session.
- High (Highest Price)– the highest price level reached during the period.
- Low (Lowest Price)– the lowest price level during that period.
A candlestick consists of a body and a shadow (or wick). Candlesticks are typically colored green (bullish, rising prices) and red (bearish, falling prices).
From here we can see the meaning of candlestick charts as a representation of market psychology: the dominance of buyers or sellers in a period.
Read Also: Bitcoin Rainbow Chart: Understanding and Understanding BTC Market Sentiment
How to Read Candlestick Charts for Beginners
For those who want to learn candlesticks for beginners, here are the basic points to understand price movement patterns:
- Green candlestick: indicates the closing price is higher than the opening price → uptrend.
- Candlestick merah: indicates the closing price is lower than the opening price → downtrend.
- Long body: indicates strong price movement (big momentum).
- Long axis: indicates high volatility, the price fluctuates a lot before returning to a certain level.
By reading this combination, investors can understand whether the market is in an up, down, or uncertain phase.
Commonly Used Candlestick Patterns
Candlestick charts also display certain patterns that can help predict price direction. Some popular patterns include:
- Hammer– small body with a long lower wick. Signals a potential trend reversal from bearish to bullish.
- Doji– the opening and closing prices are nearly the same. This indicates market confusion or uncertainty about direction.
- Bullish Engulfing– a large green candlestick that engulfs the previous red candlestick. A sign of potential price increases.
- Bearish Engulfing– a large red candlestick that engulfs the previous green candlestick. This indicates a potential price decline.
- Morning Star & Evening Star– a three-candlestick pattern that indicates a major trend reversal, each in the bullish and bearish direction.
Read Also: Crypto Trading Mistakes to Avoid
Candlestick Chart vs Line Chart
Many beginners ask, what is the difference between a candlestick chart and a line chart?
- Line chart: displays only the closing price as a line. Simple, but minimal in detail.
- Candlestick chart: more complex, as it shows the open, close, high, and low in a single bar. More detailed reading of market psychology.
Therefore, the candlestick chart reading method is preferred by active traders, especially in markets with high volatility such as daily stocks or crypto candlestick charts.
The Importance of Candlestick Charts in Trading
Mastering candlestick charts helps investors to:
- Quickly see market trends.
- Analyzing price momentum.
- Predicting potential trend reversals.
- Make smarter trading decisions.
However, it's important to remember that candlesticks aren't a standalone tool. It's best to combine them with other technical indicators like RSI, MACD, or fundamental analysis to strengthen your investment strategy.
Read Also: Understanding Bitcoin's CME Gaps: The Right Strategy for Crypto Traders
How to Buy Crypto on Bittime
Want to trade sell buy Bitcoins and crypto investment easily? Bittime is here to help! As an Indonesian crypto exchange officially registered with Bappebti, Bittime ensures every transaction is safe and fast.
Start with registration and identity verification, then make a minimum deposit of IDR 10,000. After that, you can immediately buy your favorite digital assets!
Check the exchange rate BTC to IDR, ETH to IDR, SOL to IDR and other crypto assets to find out today's crypto market trends in real-time on Bittime.
Also, visit the Bittime Blog for interesting updates and educational information about the crypto world. Find reliable articles about Web3, blockchain technology, and digital asset investment tips designed to enrich your crypto knowledge.
FAQ
What is a candlestick chart?
A candlestick chart is a price chart that displays the open, close, high, and low data in a single candlestick, typically used in technical analysis of stocks and crypto.
How to read candlestick charts for beginners?
The basics are understanding candlestick colors (green = up, red = down), body length (momentum), and wick length (volatility).
What is the difference between a candlestick chart and a line chart?
Line charts only display closing prices, while candlestick charts display more complete price data, thus providing a picture of market psychology.
Do candlestick charts apply to crypto?
Yes, candlestick charts are very popular in the crypto market because they can show very volatile price movements in the short term.
Is it enough to just learn candlesticks to be successful in trading?
No. Candlesticks are just one tool. Traders should combine candlestick analysis with other technical indicators and sound risk management.
Disclaimer: The views expressed belong exclusively to the author and do not reflect the views of this platform. This platform and its affiliates disclaim any responsibility for the accuracy or suitability of the information provided. It is for informational purposes only and not intended as financial or investment advice.

.png)