Easy Ways to Determine Support and Resistance for Beginner Traders
2026-06-03
Bittime - Support and resistance are basic concepts in technical analysis that must be mastered beginner trader.
Support is a price level where buying pressure is strong enough to stop a decline, like a “floor.”
Resistance is the level at which selling pressure prevents further increases, like a “ceiling”.
By understanding support and resistance levels, you can determine when to enter, when to exit, and where to place your stop loss.
This article will discuss an easy way to determine support and resistance for beginner traders.
Key Points
Support is the price "floor"– The point at which prices tend to bounce upwards. Resistance is the "ceiling" below which prices tend to fall.
Use swing high and swing low– Draw horizontal lines at recurring highs and lows. The more frequently they are touched, the more valid they are.
Role reversal– Resistance that is broken can turn into support, and vice versa.
Register at Bittime now and start trading crypto with a fast, safe, and easy process in the app.
What is Support and Resistance?
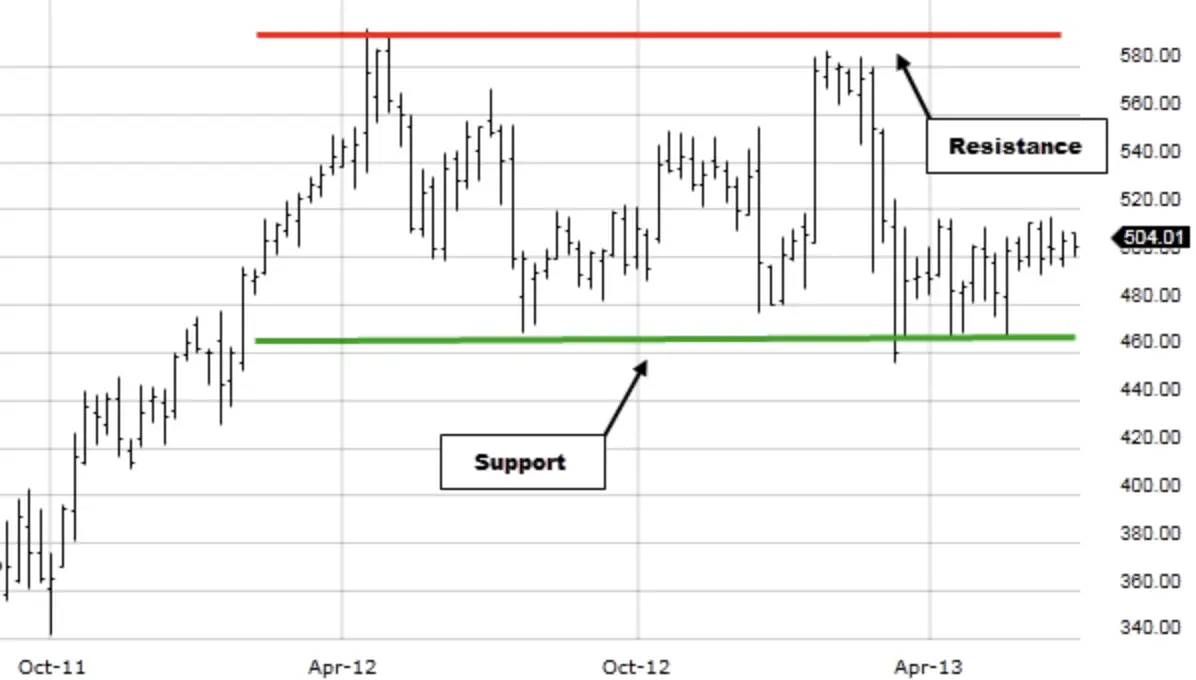
Source: Fidelity.com
Support is a price level where demand is strong enough to stop a price decline. When the price approaches support, many traders buy because the price is perceived as cheap, causing the price to rebound.
Resistance is the opposite. It's the level where supply is strong enough to stop price increases. Traders tend to sell at resistance levels because prices are perceived as expensive.
Support and resistance are not single precision lines, but rather zones with a tolerance of around 1-2%.
Price may touch the area several times before actually bouncing or breaking through it.
Read also:How to Choose Leverage for Beginners and the Risks
How to Determine Support and Resistance for Beginners
Here is the simplest method that can be put into practice immediately.
1. Identify Swing High and Swing Low
A swing low is the lowest point before the price rises again. A swing high is the highest point before the price falls.
Draw horizontal lines at these levels on the daily (D1) or 4-hour (H4) timeframe. The more times the price bounces off the same level, the more valid the support/resistance area is.
2. Use Horizontal Lines
The easiest way: look at the chart and find areas where the price repeatedly stops falling (support) or stops rising (resistance). Draw a horizontal line in those areas. Perfect precision isn't necessary; the zone is more important than a single line.
3. Watch the Volume as Confirmation
High volume around support indicates a large number of buyers holding positions, increasing the chance of a rebound. High volume at resistance indicates strong selling pressure, increasing the potential for a decline.
A valid breakout is usually accompanied by high volume. Breakouts with low volume are often false signals.
Read also:The Most Accurate and Best Crypto Trading Indicator Combination 2026
Role Reversal: When Support Becomes Resistance
One of the most important concepts in determining support resistance is role reversal.
When the price breaks through resistance, that resistance level often becomes new support. Conversely, when the price breaks through support, that support level can become new resistance.
This happens because of market psychology: areas that previously blocked the rise now become footholds, and vice versa.
Use Moving Average as Dynamic Support/Resistance
Besides horizontal lines, moving averages (MA) can function as moving (dynamic) support/resistance.
The 50-day moving average (MA50) is often used by medium-term traders. If the price bounces off the 50-day moving average (MA50), the uptrend is still healthy.
The 200-day moving average (MA) is a key support/resistance level in the long-term trend. If the price breaks through the 200-day moving average (MA), be aware of a potential trend reversal.
How to read a trading chart with moving averages: Observe how the price reacts each time it touches the moving average line. If it repeatedly bounces off the moving average, it's a valid dynamic level.
Read also:How to Read Candlestick Trading Correctly and Easily
Beginner Trading Strategy with Support/Resistance
Here's a simple strategy:
Strategy 1: Buy at Support, Sell at Resistance
Buy when the price approaches a support area (confirmed by a reversal candlestick). Sell when the price approaches a resistance area. Place a stop-loss just below support (for long positions) or above resistance (for short positions).
Strategy 2: Breakout Trading
If the price breaks through resistance with high volume, open a buy position. Target the next resistance. If the price breaks through support with high volume, open a sell position.
Strategy 3: Role Reversal Trading
After breaking out of resistance, wait for the price to retest that level (which has now become support). If the price bounces, it's a strong buy signal.
Common Mistakes to Avoid
Using too small a timeframe (5 minutes)– Support/resistance levels on smaller timeframes are too easily breached. Use a 4-hour or daily timeframe.
Consider support/resistance as absolute lines– Remember, these are zones, not precision lines.
Not updating level– Markets change, important levels of the past may lose their relevance.
Ignore volume– Breakouts without volume are potential false signals.
Read also:Spread Trading - Definition, Mechanism, Advantages, and Risks
Conclusion
How to determine support and resistance for beginners begins by identifying swing highs and swing lows, then drawing a horizontal line. The more times the price bounces off the same level, the more valid the level is.
Beginner support resistance traders also need to understand the concept of role reversal: broken resistance can become support, and vice versa.
Use moving averages as dynamic support/resistance, and volume as breakout confirmation.
Support and resistance levels aren't absolute, but with practice and discipline, beginner technical analysis will become more accurate. Start practicing now on your favorite trading charts.

Bittime is a licensed and regulated Digital Financial Asset Trader (PAKD) supervised by Indonesia’s Financial Services Authority (OJK) — where you can buy Bitcoin in Indonesia and hundreds of other crypto assets starting from just Rp10,000. The registration process is fast, secure, and you can get started today.
Track USDT to IDR conversions and monitor your favorite crypto assets in real time. Everything is available in one crypto investment app that you can download for free on the Play Store
Ready to start? Register now on Bittime and execute your investment strategy with a platform trusted by millions of users in Indonesia.
FAQ
What is support in trading?
Support is a price level where buying pressure is strong enough to stop a price decline, like a “floor.”
What is resistance in trading?
Resistance is a price level where selling pressure is strong enough to stop a price increase, like a “ceiling”.
How to determine support resistance for beginners?
Look at the swing highs and swing lows on a 4-hour or daily chart. Draw horizontal lines at points where the price repeatedly bounces or stops.
What is role reversal?
When support is broken, it can turn into resistance. When resistance is broken, it can turn into support.
What is the function of moving average in support/resistance?
Moving averages can act as dynamic support/resistance. The 50-day moving average (MA) is used for intermediate trends, and the 200-day moving average (MA) is used for long-term trends.
Disclaimer: The views expressed belong exclusively to the author and do not reflect the views of this platform. This platform and its affiliates disclaim any responsibility for the accuracy or suitability of the information provided. It is for informational purposes only and not intended as financial or investment advice.

.png)