How to Read Coinglass Heatmap: Complete Guide to Liquidation & Liquidity
2026-03-31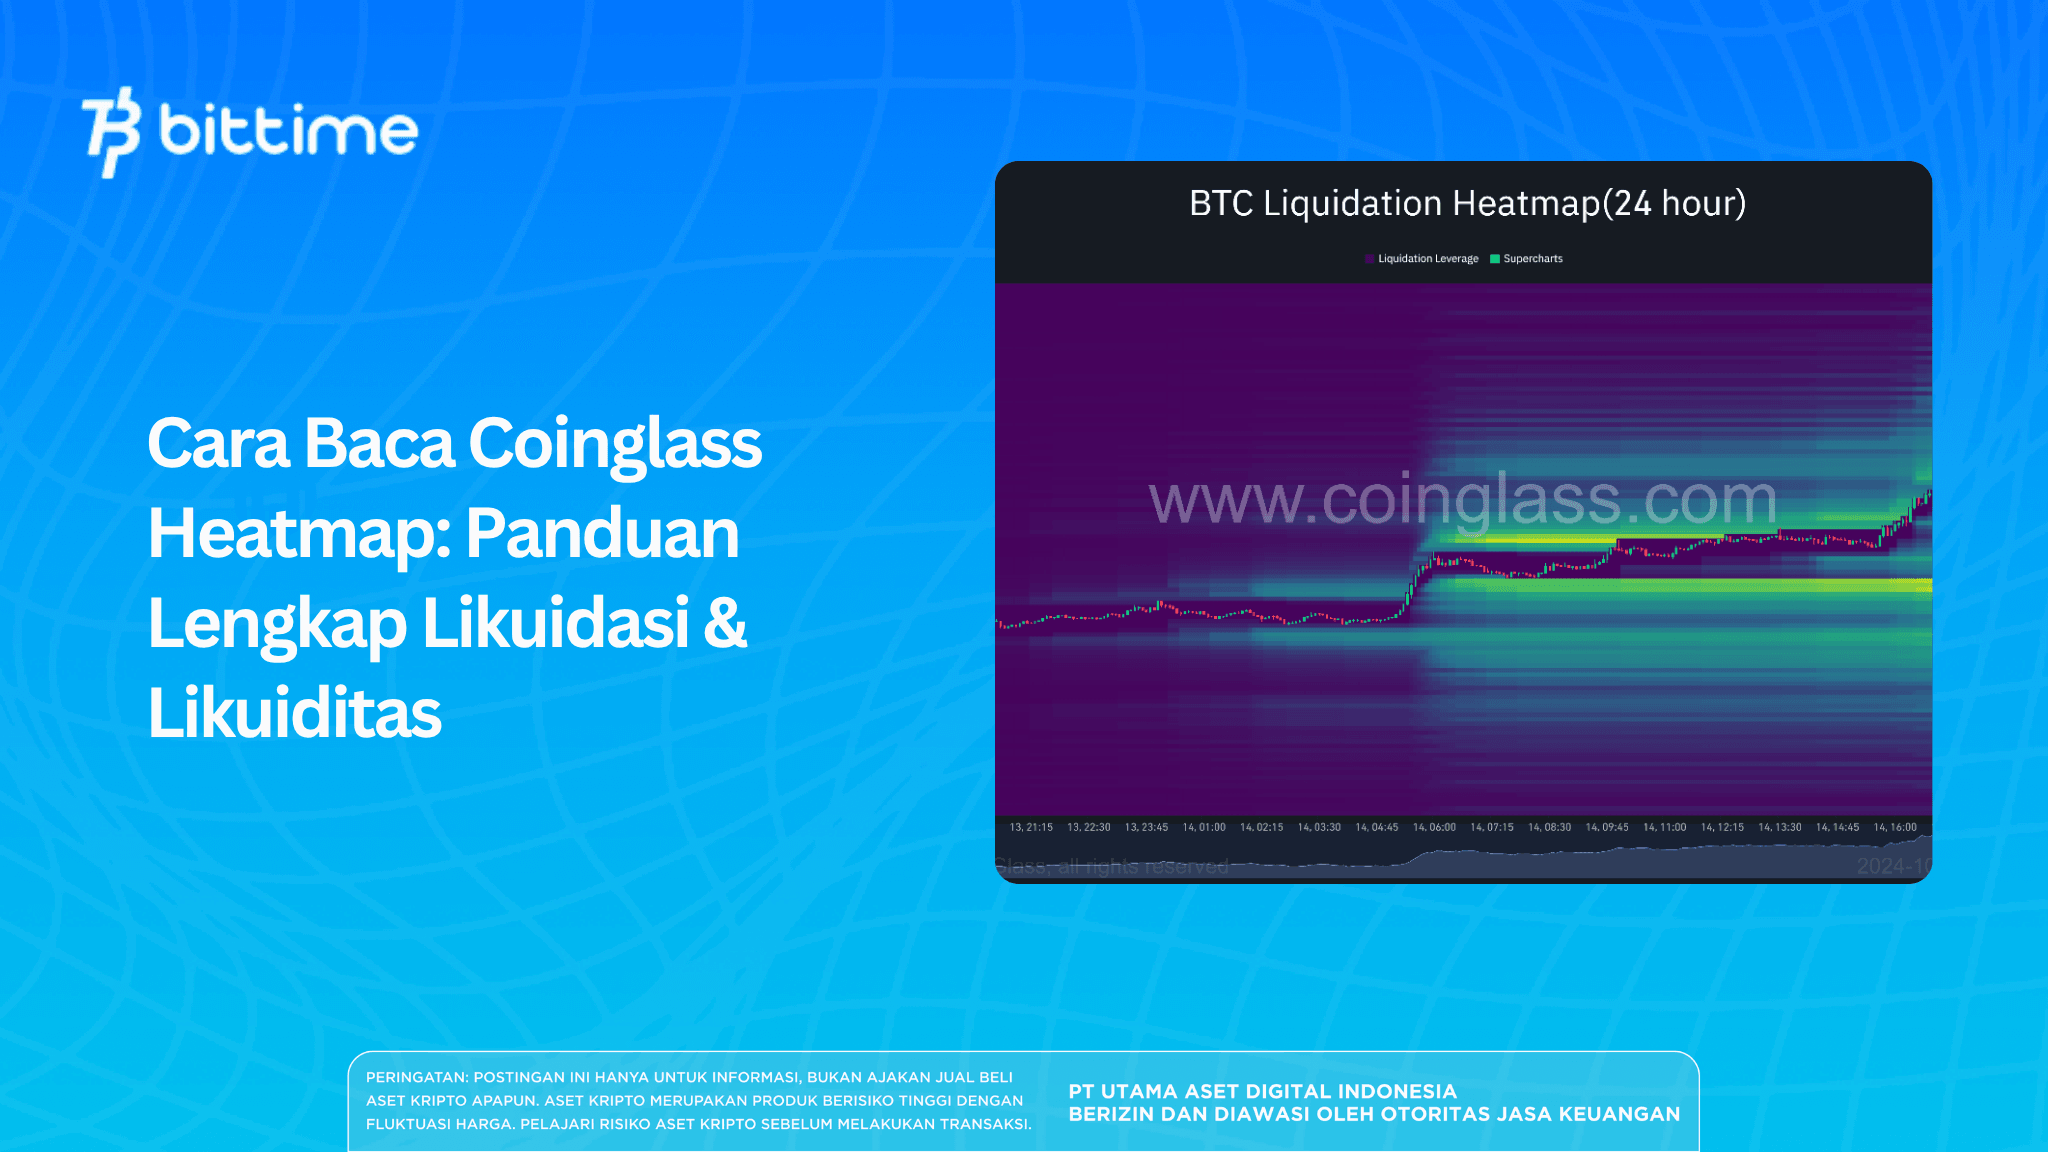
The Coinglass heatmap has become one of the most referenced tools among professional crypto traders — and for good reason.
It layers two critical datasets into a single color-coded chart: where liquidation pressure is concentrated, and where market order activity is densest. The result is a visual map that, when read correctly, reveals price "magnets" invisible on standard candlestick charts.
This guide walks through how to read the Coinglass crypto heatmap from scratch — covering color interpretation, liquidation zone identification, the concept of magnetic zones, and how to combine the tool with other indicators for sharper, more informed trading decisions.
Key Takeaways
• The Coinglass heatmap visualizes liquidation and order-book activity in a single color-coded chart — brighter colors indicate higher concentration and greater risk.
• Bright yellow zones on the liquidation heatmap often act as price magnets, as whales and trading algorithms tend to push prices toward them to trigger cascading liquidations.
• The heatmap is most effective when used alongside other indicators such as open interest, market depth, and technical analysis — not as a standalone signal.
What Is the Coinglass Heatmap and How Does It Work?
Coinglass provides two distinct heatmap types that are often confused: the liquidation heatmap and the liquidity heatmap. They serve different purposes.
The liquidation heatmap maps where leveraged positions are at risk of forced closure, calculated using trading volume, leverage ratios, and long/short position data from major exchanges including Binance, Bybit, and OKX.
The liquidity heatmap, by contrast, displays the distribution of active orders in the order book, revealing where market activity is most concentrated. On both charts, the vertical axis represents price levels and the horizontal axis represents time.
The color scale is consistent across both: dark purple signals low intensity, while bright yellow marks the highest concentration zones that demand a trader's attention.
Register on Bittime now and start trading crypto with a fast, secure, and easy process on the app.
How to Read the Colors and Liquidation Zones on the Coinglass Heatmap
The entire logic of reading the Coinglass crypto heatmap centers on its color gradient. Dark purple or blue areas represent low liquidation density — relatively safe zones where fewer forced closures are expected.
Bright yellow or light-red areas are critical zones, where a significant number of leveraged positions face simultaneous liquidation risk.
Zones above the current price typically represent short positions; if the price rises into them, a short squeeze can be triggered. Zones below the current price represent long positions; if the price falls into them, a cascade of long liquidations can accelerate the downside.
Coinglass covers timeframes from 12 hours to one year, so short-term traders should focus on 12–24 hour data, while longer-term investors benefit more from 30-day or annual views.
Magnetic Zones: The Key Concept Most Traders Overlook
One of the most important ideas in reading the Coinglass liquidation heatmap is the concept of magnetic zones. A magnetic zone is a price range with a high concentration of liquidation levels that tends to "attract" price movement toward it.
This happens because large numbers of open contracts and leveraged positions cluster in these areas — as price approaches, the probability of liquidation spikes sharply, which then accelerates price movement further in that direction.
The trading implication is clear: if a bright yellow magnetic zone sits close to the current price, there is a meaningful probability that price will move toward it before reversing.
A common strategy is to avoid opening positions directly in front of a magnetic zone, or alternatively, to trade with the momentum it creates by entering in the direction of the pull.
Conclusion
The Coinglass heatmap is a powerful analytical tool, not a crystal ball. By understanding the difference between liquidation and liquidity heatmaps, reading the color gradient correctly, and recognizing magnetic zones, traders can build a significantly clearer picture of where market pressure is building. The key is always to combine heatmap data with other indicators — open interest, technical analysis, and market depth — while maintaining strict risk management discipline, because heatmaps reveal probability, not certainty.
FAQ — Frequently Asked Questions
1. What is the difference between the liquidation heatmap and the liquidity heatmap on Coinglass?
The liquidation heatmap shows where leveraged positions are at risk of forced closure based on derivatives market data. The liquidity heatmap displays the distribution of active orders in the order book. Both use similar color scales but draw from different data sources.
2. What does bright yellow mean on the Coinglass heatmap?
Bright yellow marks zones with the highest concentration of liquidation pressure or order activity. These areas are critical to monitor because price frequently moves toward them, and breaching them can trigger sharp, rapid moves.
3. Which timeframe should I use for day trading?
The 12-hour or 24-hour timeframes are most relevant for day traders. Swing traders can use the 7-day view, while long-term investors benefit most from the 30-day to 1-year range.
4. Does the Coinglass heatmap cover all cryptocurrencies?
Coinglass provides heatmap data for major assets like BTC and ETH, along with other large-cap altcoins actively traded in the futures markets of leading exchanges.
5. How accurate is the Coinglass crypto heatmap for predicting price movements?
The heatmap displays relative intensity, not guaranteed liquidation amounts. Its predictive value increases significantly when combined with technical analysis, open interest data, and an understanding of broader market sentiment.
How to Buy Crypto on Bittime?

Want to trade sell buy Bitcoins and crypto investment easily? Bittime is here to help! As an Indonesian crypto exchange officially registered with Bappebti, Bittime ensures every transaction is safe and fast.
Start with registration and identity verification, then make a minimum deposit of IDR 10,000. After that, you can immediately buy your favorite digital assets!
Check the exchange rate BTC to IDR, ETH to IDR, SOL to IDR and other crypto assets to find out today's crypto market trends in real-time on Bittime.
Also, visit the Bittime Blog for interesting updates and educational information about the crypto world. Find reliable articles about Web3, blockchain technology, and digital asset investment tips designed to enrich your crypto knowledge.
Disclaimer: The views expressed belong exclusively to the author and do not reflect the views of this platform. This platform and its affiliates disclaim any responsibility for the accuracy or suitability of the information provided. It is for informational purposes only and not intended as financial or investment advice.

.png)