Glassnode Bitcoin Analysis: Bottom Signs Starting to Appear, Bull Market Not Yet Here
2026-07-09
Over the past five months, Bitcoin's price has been trading below several important accumulation cost levels commonly used by on-chain analysts to read market cycles.
This condition has made many investors question whether the bearish phase has reached its lowest point or if there is still more selling pressure ahead.
Glassnode's latest report provides a more nuanced answer: the market is starting to build a foundation, but recovery signals are not yet complete.
On-chain data shows ownership distribution continues, long-term investors are still realizing losses, while institutional fund flows through spot Bitcoin ETFs in the United States have not yet returned to positive territory.
Key Takeaways
- Bitcoin is still trading below the True Market Mean and Short-Term Holder Cost Basis, indicating the market is still in a deep value zone.
- The biggest selling pressure now comes from long-term investors who are starting to capitulate after months of losses.
- Bitcoin ETFs and derivatives markets show gradual improvement, but not yet strong enough to confirm the start of a new bullish trend.
Bitcoin Still in Deep Value Zone
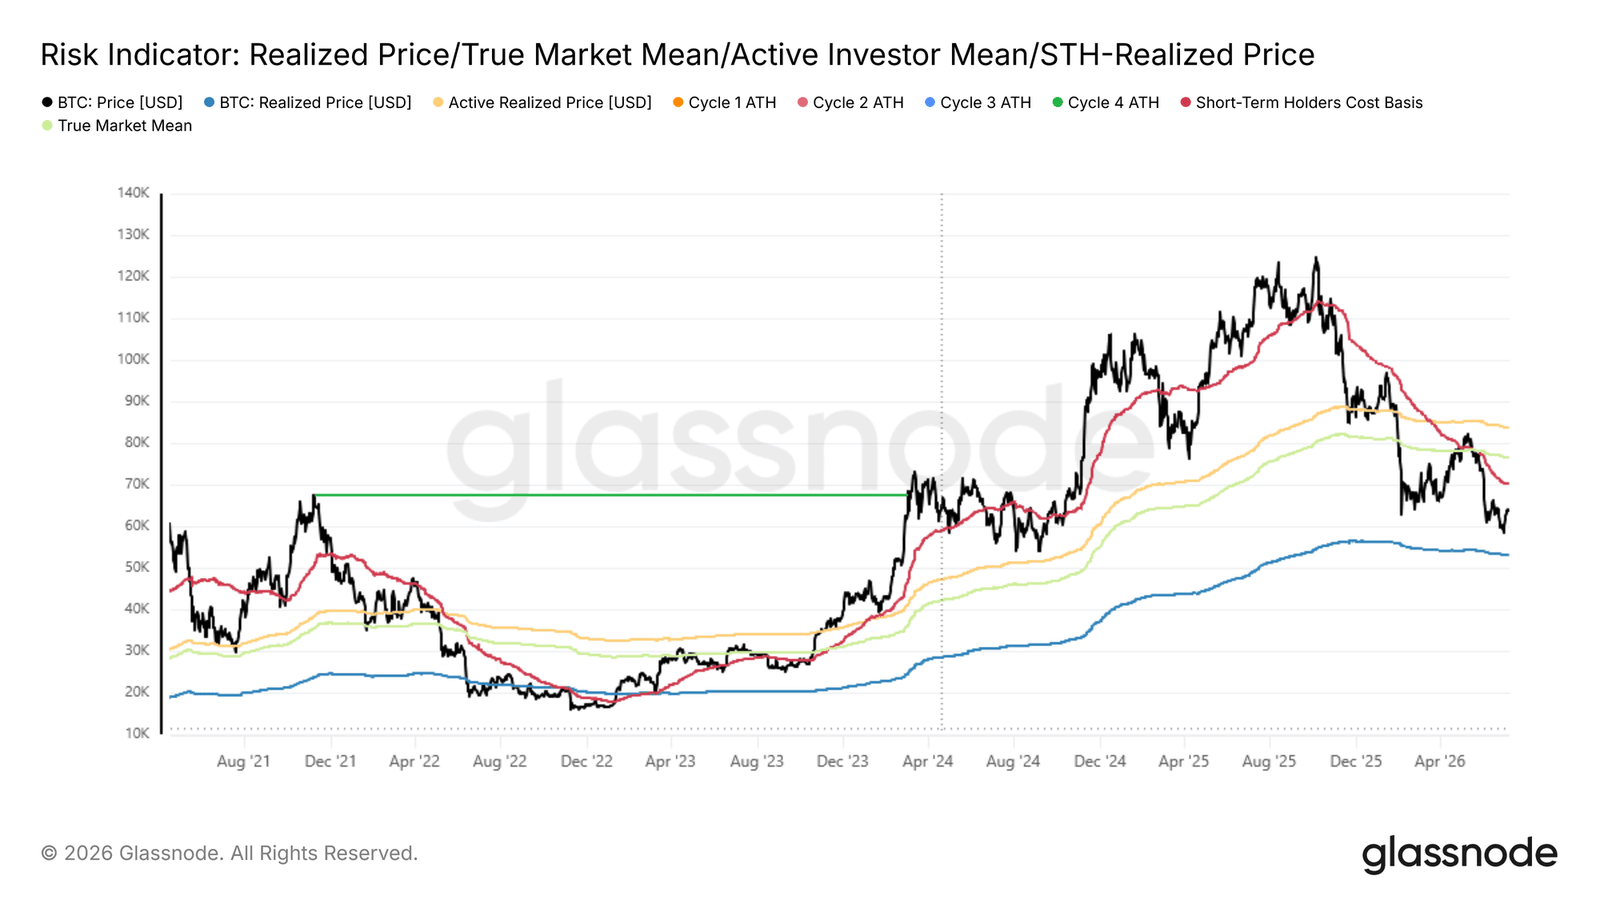
According to the The Week On-chain Week 27 report from Glassnode, Bitcoin briefly recovered from around US$58,300 to the US$64,400 range.
However, that price is still below two very important on-chain levels, namely the True Market Mean around US$76,600 and the Short-Term Holder Cost Basis around US$72,200.
Source: Glassnode
The risk indicator chart also shows BTC price is still below the active investor average cost line. In previous cycles, such conditions often appeared when the market entered a long-term accumulation phase, where patient investors began buying assets at discounted prices.
However, Glassnode reminds that risks have not completely disappeared. If selling pressure increases again, Bitcoin still has the potential to test the Realized Price around US$53,000, which has historically been the lower boundary in bear market phases.
Read Also: Bernstein Maintains $150K Bitcoin Target Despite 54% Pullback
Long-Term Investor Capitulation Still a Hurdle
One of the most important findings in the report is the shift in the source of selling pressure.
If previously sales mostly came from short-term investors, now Long-Term Holders (LTH) have become the largest contributor to realized losses. The share of losses from this group has increased from around 15% in early February to 43% of the total realized loss value on the Bitcoin network.
Glassnode notes that the Entity-Adjusted Long-Term Holder Realized Loss metric even reached around US$280 million per day, the highest since December 2022. This indicates that some investors who bought Bitcoin near the end of the cycle have finally chosen to sell after holding for months.
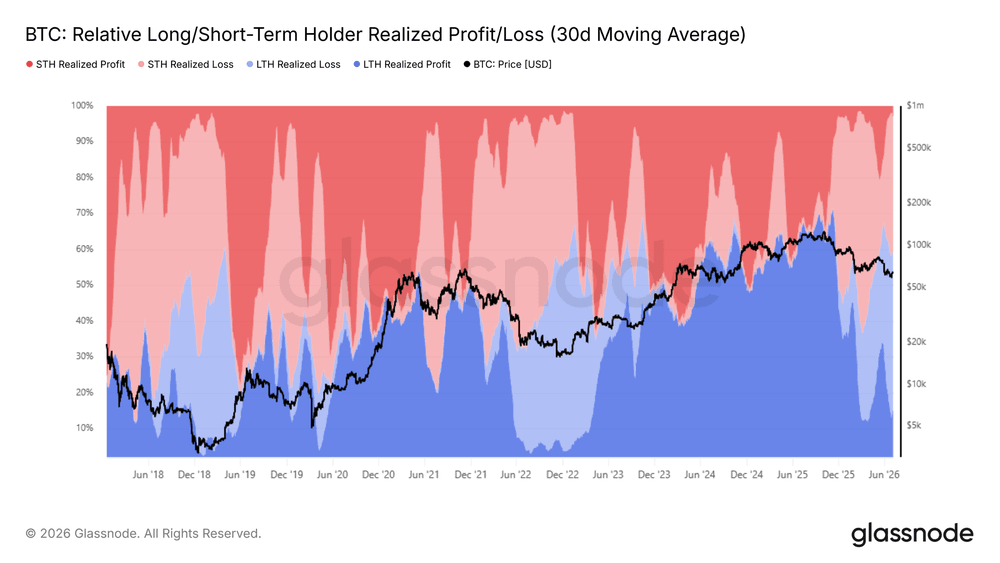
According to Glassnode, the new bottom formation process will become stronger if this capitulation wave starts to consistently subside.
As long as this metric remains high, every price increase has the potential to face new distribution pressure.
Why not start investing in and trading Bitcoin? Register to Bittime – it’s quick, secure and easy.
Read Also: How to Buy Bitcoin Safely and Cheaply in Indonesia
ETFs and Derivatives Markets Starting to Improve, But Not Strong Enough Yet
In addition to on-chain data, Glassnode also highlights institutional market conditions.
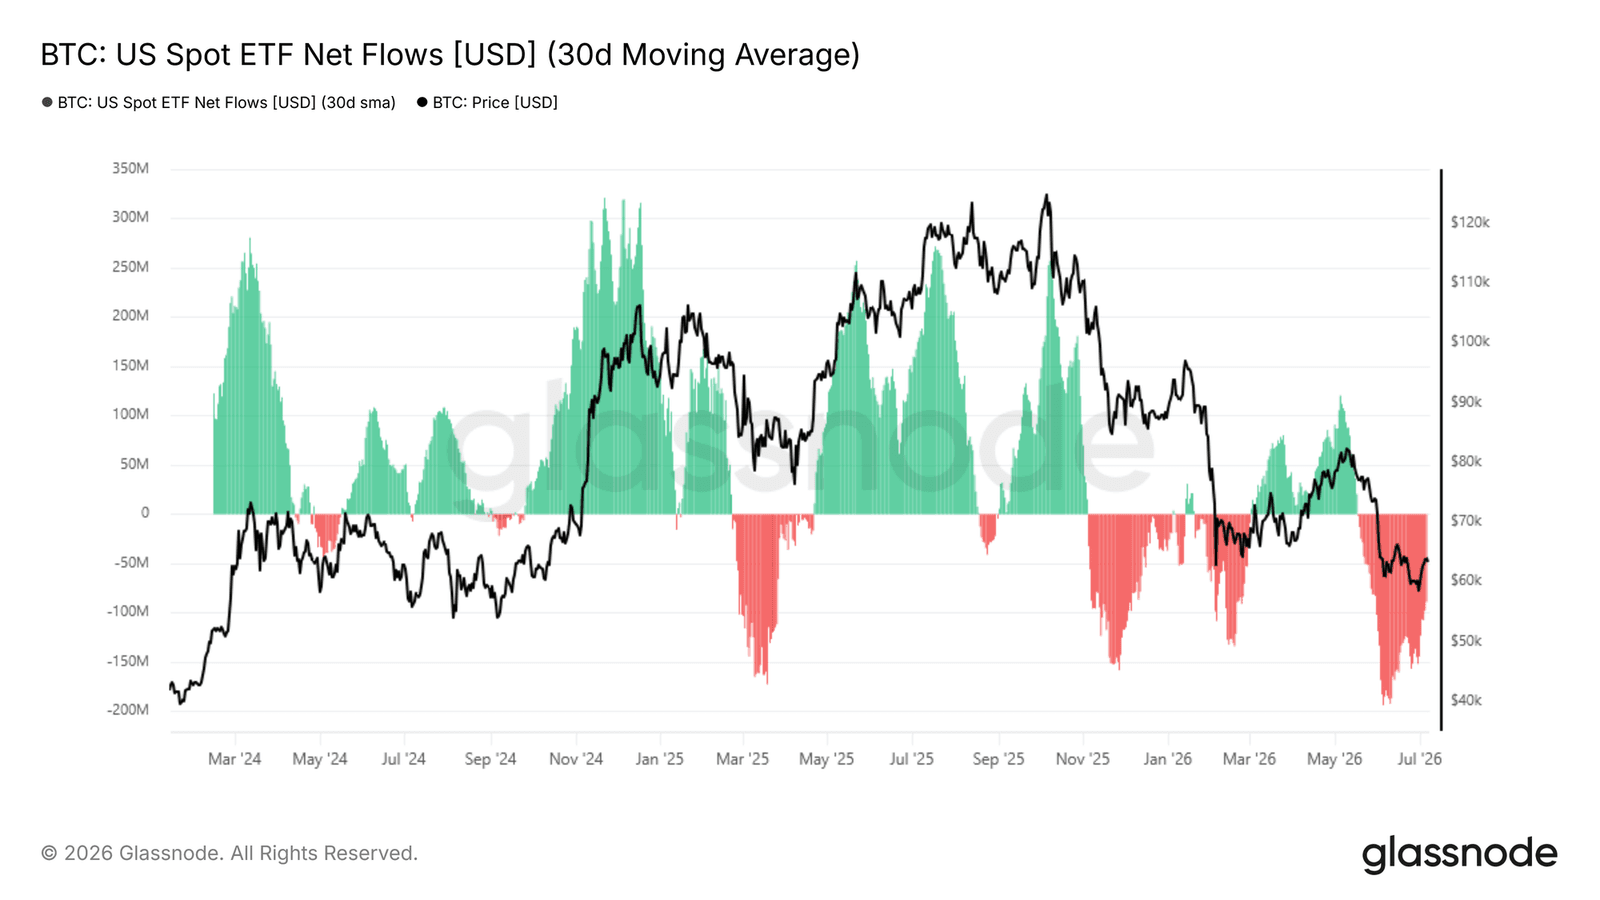
Net outflows from spot Bitcoin ETFs have indeed started to slow. The average daily outflow dropped from around US$193 million in early June to around US$88.9 million.
However, fund flows are still in negative territory, so institutional interest has not fully recovered. ETF trading volume is also still around 80% lower than its peak in October 2025.
In the derivatives market, the situation is slightly different. The put/call ratio has fallen to 0.56, the lowest level throughout 2026. This figure shows traders are starting to open more call positions than puts, indicating optimism is beginning to return.
However, the options structure still shows higher premiums for downside protection, so market participants remain cautious.
One of Glassnode's charts also shows Bitcoin trading around 6% below the aggregated max pain level of US$66,000. In recent months, this level has often acted as a price "gravity" ahead of options contract expiration.
If BTC can hold above US$66,000, the short-term outlook is considered more constructive. Conversely, widening the distance from that level will strengthen defensive sentiment in the options market.
Read Also: How to Buy SpaceX Tokenized Stock (SPCXon): SpaceX Ondo Token Stock Guide
Conclusion
Glassnode's latest report shows Bitcoin is entering a bottom building phase, a stage where the market gradually builds a foundation before potential trend changes.
Several indicators such as slowing ETF outflows, improving derivatives positions, and price holding above Realized Price provide early signals that selling pressure is starting to ease.
However, bull market confirmation is not yet visible. Long-term investors are still realizing large losses, institutional capital flows have not returned to positive, and Bitcoin's price is still moving below the active investor average cost level.
As long as these indicators do not improve consistently, Glassnode assesses the market is still in the final stage of bottom formation, not at the beginning of a new uptrend.

Check prices for Bitcoin (BTC), Ethereum (ETH), XRP, Solana (SOL), Polygon (POL), and BNB as well as leading memecoins DOGE. You can trade directly on Bittime!
Bittime is a licensed and supervised Digital Financial Asset Trader (PAKD) platform by the Financial Services Authority — a place where you can buy Bitcoin in Indonesia and hundreds of other crypto assets starting from Rp10,000. The registration process is fast, secure, and can be started today.
Monitor USDT to IDR conversion and the price movements of your favorite crypto assets in real-time. All available in one crypto investment app that can be downloaded for free on the Play Store.
Ready to start? Register now at Bittime and execute your investment strategy with a platform trusted by millions of users in Indonesia.
FAQ
What is meant by bottom building in Bitcoin?
Bottom building is the phase when the price moves in a low area for a sufficiently long time while ownership transfers occur from sellers to investors accumulating the asset.
Why are Long-Term Holders a concern?
Because this group usually sells in large volumes when they lose confidence, which can prolong pressure on Bitcoin's price.
What does True Market Mean mean?
True Market Mean is an estimate of the active market average cost used by Glassnode to measure whether Bitcoin is trading above or below its fair value.
Why are Bitcoin ETFs important for BTC price?
ETF fund flows reflect institutional demand. Increasing net inflows generally signal growing buying interest from large investors.
Does the Glassnode report state that the bull market has already started?
Not yet. Glassnode assesses that conditions for bottom formation are starting to appear, but the market still needs reduced selling pressure, stabilization of ETF flows, and price recovery above major investor cost levels before a bullish trend can be confirmed.
Disclaimer: The views expressed belong exclusively to the author and do not reflect the views of this platform. This platform and its affiliates disclaim any responsibility for the accuracy or suitability of the information provided. It is for informational purposes only and not intended as financial or investment advice.

.png)