Bitcoin Price Analysis and Prediction for February 15, 2026 (BTC/USDT)
2026-02-14
Bitcoin is trading at 69,099.97 USDT, up 5.45% in the last 24 hours, according to the BTC/USDT 15 minute chart on Bittime. The session high reached 69,438.75 USDT, while the daily low dipped to 65,136.10 USDT.
After a strong rebound from the 65,000 area, Bitcoin has built steady upward momentum. The price is now hovering just below short term resistance near 69,400 to 70,000, placing the market at a technical decision point ahead of February 15, 2026.
Below is a structured technical breakdown, including support and resistance levels and a price projection based on the latest chart data.
Key Takeaways
- Bitcoin gained over 5% in 24 hours and is consolidating near 69,000 USDT.
- Immediate support lies near 68,200 and 66,600 USDT.
- A confirmed breakout above 69,400 could push BTC toward 70,500 to 72,000.
BTC/USDT Market Structure Overview
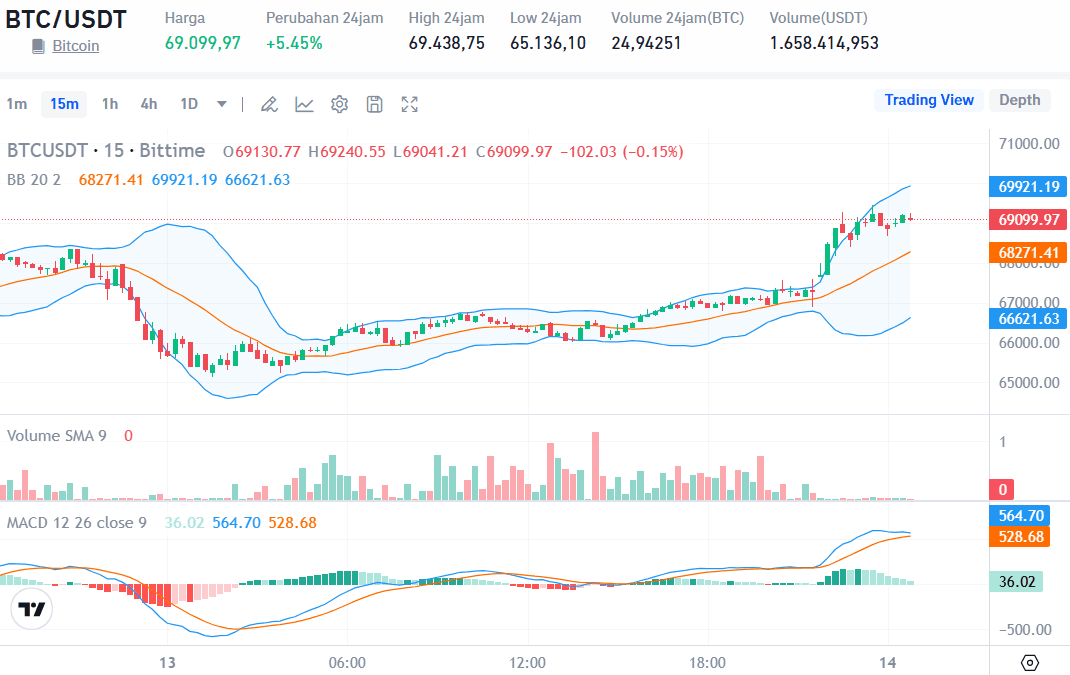
On the 15 minute timeframe, Bitcoin shows a clear V shaped recovery from the 65,100 region. After initial accumulation, price formed higher lows and gradually expanded upward, supported by rising volume.
The rally accelerated as BTC broke above the 68,000 area, triggering momentum buying. However, near 69,400, the chart shows signs of slowing, with smaller candles and reduced follow through.
Despite this pause, the structure remains bullish. Higher highs and higher lows are still intact. As long as Bitcoin holds above 68,000, short term buyers maintain control.
The market is currently consolidating near resistance, a common setup before either a breakout or short term pullback.
Technical Indicators: Bollinger Bands and MACD
The Bollinger Bands have widened, reflecting increased volatility during the breakout phase. The upper band is positioned near 69,921 USDT, while the middle band sits around 68,271 USDT, and the lower band is near 66,621 USDT.
Price recently tested the upper band, signaling short term overbought conditions. A brief consolidation or mild retracement toward the middle band would be technically healthy.
The MACD remains bullish, with the MACD line above the signal line. However, the histogram bars are beginning to shrink, indicating momentum is slowing.
If the histogram expands again, BTC could attempt another push above 69,400. A bearish crossover would increase the probability of a retracement toward 67,000.
Bitcoin Support and Resistance Levels for February 15, 2026
Key Support Levels
- 68,271 USDT as immediate dynamic support
- 66,621 USDT as secondary support
- 65,100 USDT as strong structural support
A drop below 68,000 may trigger a move toward 66,600. If 65,000 fails, the short term bullish structure would weaken significantly.
Key Resistance Levels
- 69,438 USDT as 24 hour high
- 70,000 USDT as psychological resistance
- 72,000 USDT as next major upside target
The 70,000 level remains crucial. A clean breakout with strong volume could attract momentum traders and extend the rally.
Bitcoin Price Prediction for February 15, 2026
Based on current technical structure, the primary scenario for February 15 is continued consolidation above 68,000 followed by a potential breakout attempt.
Bullish Scenario:
If Bitcoin holds above 68,000 and volume increases, price could break 69,438 and test 70,000. A decisive move above 70,000 may open the path toward 71,500 to 72,000.
Neutral Scenario:
Bitcoin may range between 68,000 and 69,500 while the market absorbs recent gains.
Bearish Scenario:
If momentum fades and MACD turns negative, BTC could revisit 66,600. As long as 65,100 holds, the broader short term trend remains constructive.
Overall bias for February 15 remains cautiously bullish unless 68,000 breaks with strong selling pressure.
Trading Insight
Traders should monitor price behavior near 69,400 to 70,000. Breakouts without volume confirmation often lead to false moves. Patience and confirmation are critical.
Short term entries may be considered near support zones with defined risk. Breakout traders may wait for a confirmed close above 70,000 before increasing exposure.
Volatility remains elevated, so position sizing and stop placement are essential.
Conclusion
Bitcoin enters February 15, 2026 with strong upward momentum after reclaiming 69,000 USDT. Key support lies near 68,271, while resistance stands at 69,438 and 70,000.
A breakout above resistance could push BTC toward 72,000. Failure to hold above 68,000 may trigger a short term correction toward 66,600.
The technical structure favors bulls for now, but confirmation above 70,000 will determine whether the next leg higher begins.
FAQ
What is Bitcoin’s price today?
Bitcoin is trading around 69,099.97 USDT based on the BTC/USDT chart data.
What is the main resistance level?
The key resistance is 69,438 followed by the psychological 70,000 level.
Where is the nearest support?
Immediate support is around 68,271 USDT.
Is Bitcoin still bullish?
Short term structure remains bullish as long as price holds above 65,100.
What is the short term prediction?
Bitcoin may consolidate above 68,000 before attempting another breakout toward 70,000 and beyond.
How to Buy Crypto on Bittime

Want to trade sell buy Bitcoins and crypto investment easily? Bittime is here to help! As an Indonesian crypto exchange officially registered with Bappebti, Bittime ensures every transaction is safe and fast.
Start with registration and identity verification, then make a minimum deposit of IDR 10,000. After that, you can immediately buy your favorite digital assets!
Check the exchange rate BTC to IDR, ETH to IDR, SOL to IDR and other crypto assets to find out today's crypto market trends in real-time on Bittime.
Also, visit the Bittime Blog for interesting updates and educational information about the crypto world. Find reliable articles about Web3, blockchain technology, and digital asset investment tips designed to enrich your crypto knowledge.
Disclaimer: The views expressed belong exclusively to the author and do not reflect the views of this platform. This platform and its affiliates disclaim any responsibility for the accuracy or suitability of the information provided. It is for informational purposes only and not intended as financial or investment advice.

.png)