What is the Triple Top Pattern? How to Read and Trading Strategies
2025-09-30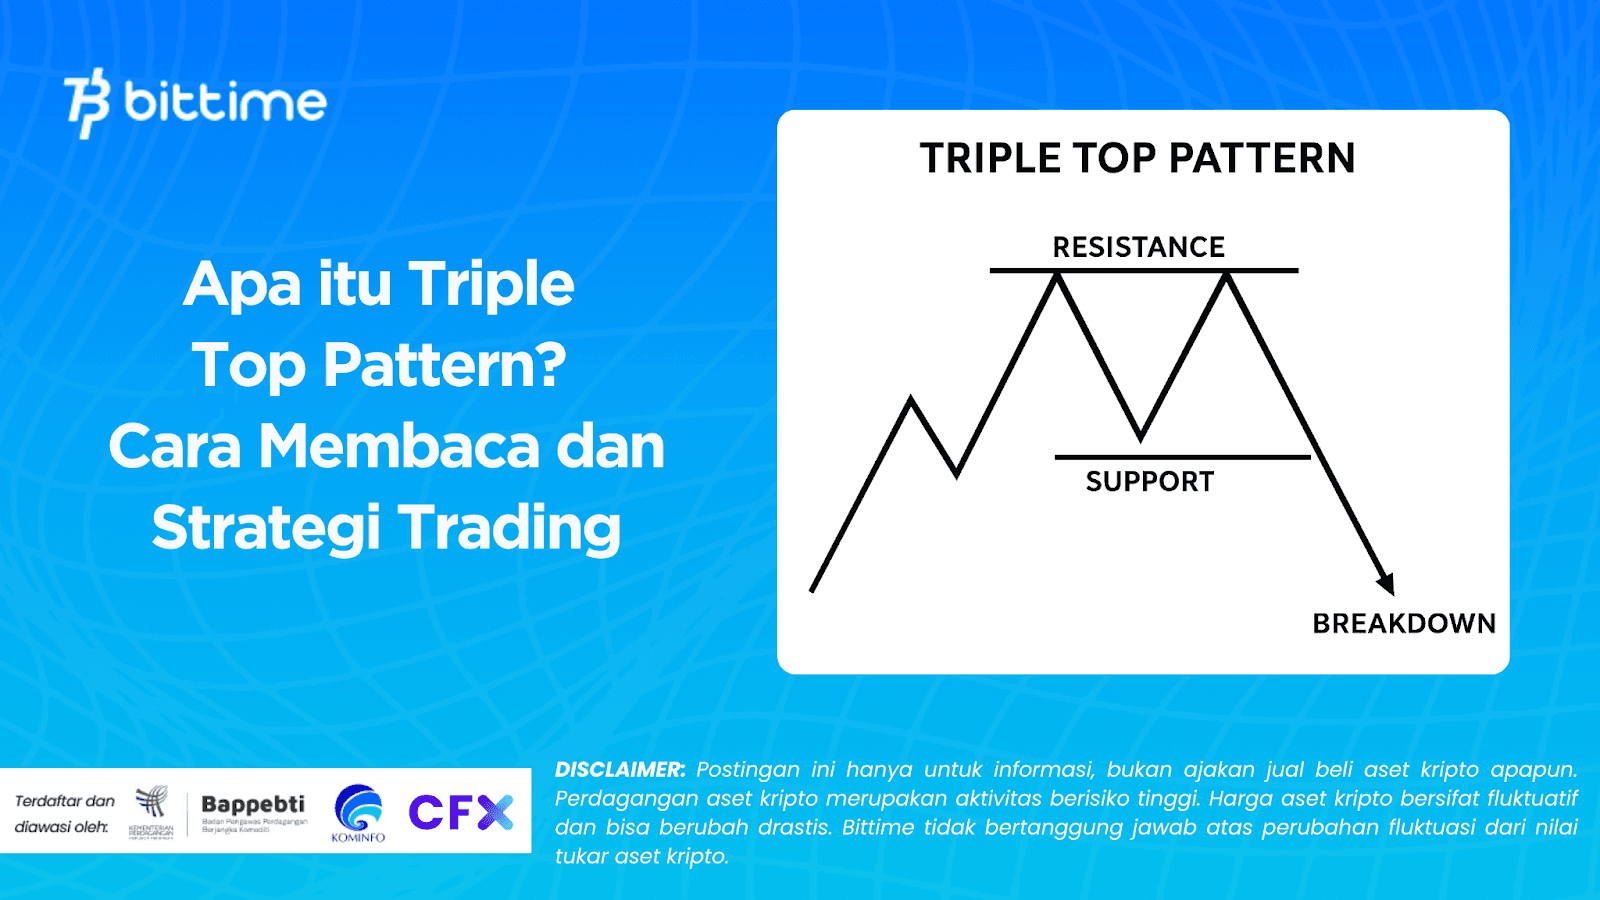
In the world of trading, chart patterns are often used as a reference for interpreting price movement direction. One popular and frequently encountered pattern is the triple top pattern.
This pattern is often considered a strong signal that an uptrend is about to end and has the potential to reverse direction into a downtrend (bearish).
For traders who understand how to read and utilize it, the triple top pattern can be a golden opportunity to determine the right trading moves. Read this article to learn more!
What is the Triple Top Pattern?
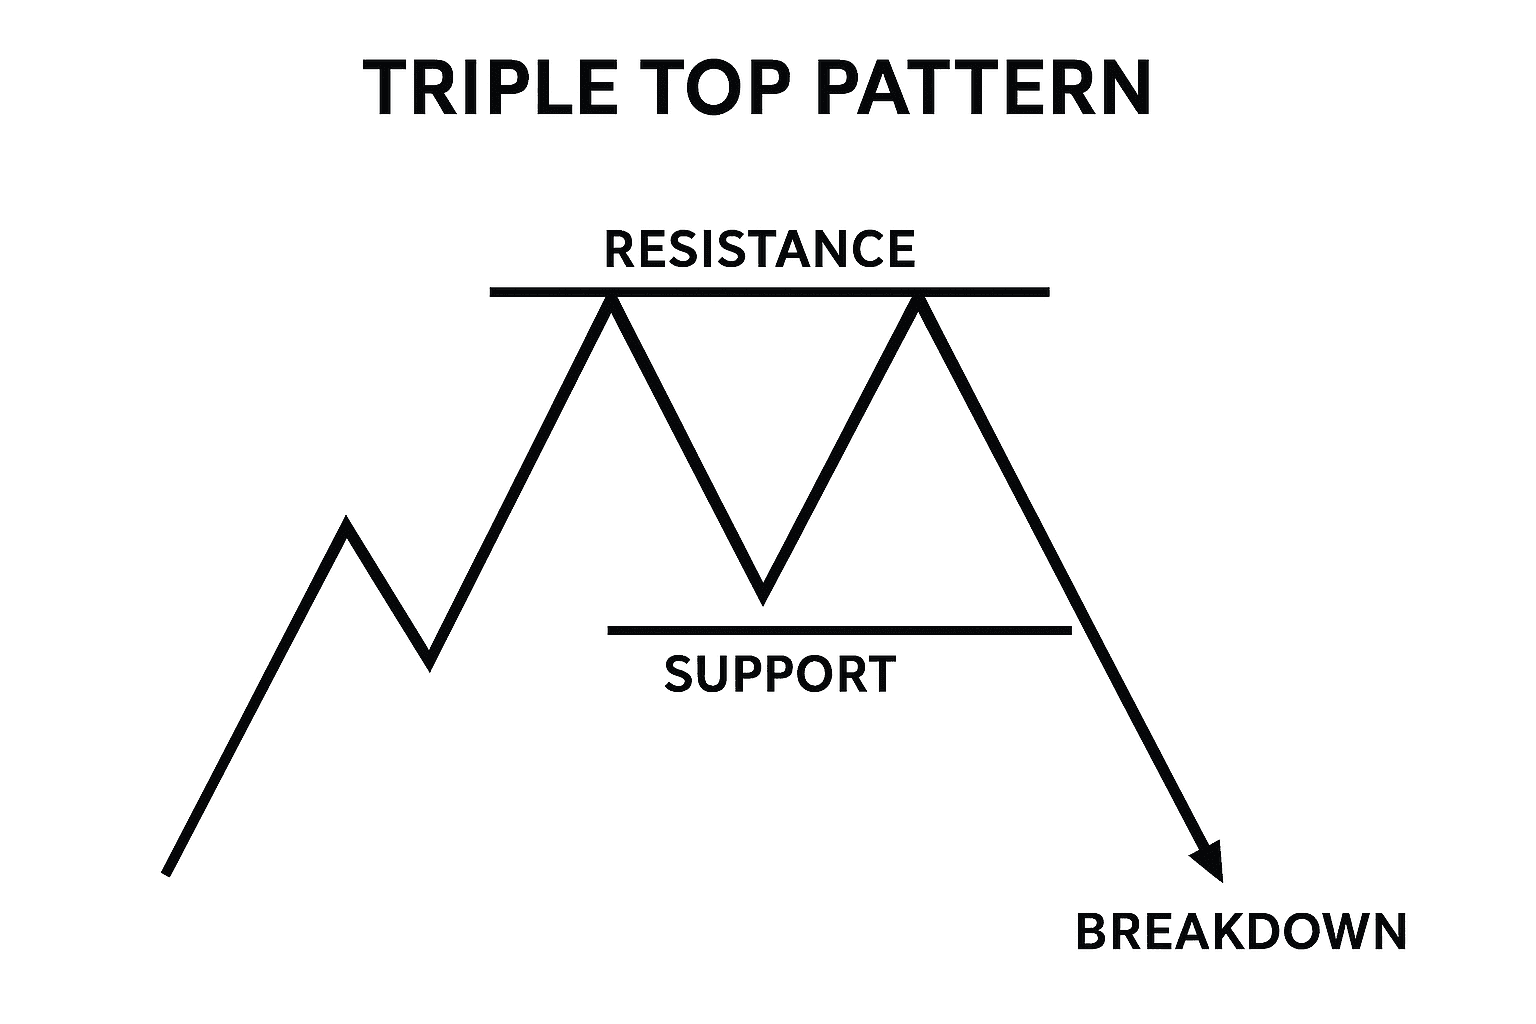
Triple top pattern is a reversal pattern typically appears after a period of significant price increases. This pattern is characterized by the formation of three relatively parallel price peaks (highs) at the same resistance level.
When the price fails to break through the resistance level three times, this pattern signals that buying pressure is weakening and sellers are taking control of the market. Once the price breaks through the support level below, this pattern is considered confirmed as a bearish signal.
In candlestick charts, the triple top pattern is often depicted as resembling the letter “M” with an additional third peak.
Read Also: What is an Initial Coin Offering (ICO)? How it Works, Benefits, and Risks
Important Aspects of the Triple Top Pattern
The triple top pattern depicts a battle between buyers (bulls) and sellers (bears). Some important aspects that shape this pattern include:
- Resistance: The peak price area that cannot be penetrated even though it has been tested three times.
- Swing lows: The area of price decline between the peaks.
- Support: The lower level, if broken, indicates the completion of the triple top and the price has the potential to fall further.
The triple top pattern also shows that buyers are losing steam, while sellers are increasingly dominating market movements.
Read Also: 3 Altcoins Predicted to Rise in October 2025
How to Read the Triple Top Pattern
For traders, recognizing this pattern early on is crucial for positioning correctly. Here's how to read a triple top pattern:
1. The price moves up to the resistance area, then fails to break through and falls back down to the support area.
2. The price tried to rise again to the resistance, but again failed to break through it.
3. Price tries once again to break through the resistance, but is again rejected and eventually falls through the support.
When the price falls below the support, this is the moment when the triple top pattern is confirmed, and usually a bearish trend will form.
Read Also: 5 Meme Coins Predicted to Rise in October 2025
How to Trade Using the Triple Top Pattern
Just like the double top pattern, the triple top pattern can be used as a reference for trading strategies. Here are the steps you can apply:
1. Identification
Make sure the pattern you see is truly valid. Beginners are usually advised to practice identifying this pattern using historical data first. This can be done by drawing a line based on the high, low, and opening and closing prices of the candle.
2. Evaluation
Once a pattern has been identified, evaluate it. Pay attention to the pattern's duration, trading volume, and price volatility. This evaluation aims to ensure the pattern isn't simply a "false pattern."
3. Prediction
Once the pattern is confirmed, traders can predict the future price direction. Triple tops typically signal a bearish trend, so traders might consider opening a short position.
Read Also: 3 Potentially Moonbag Altcoins in October 2025
Important Rules When Trading with the Triple Top Pattern
To make your trading strategy more effective, there are several rules you should pay attention to when using the triple top pattern, namely:
1. Make sure the pattern forms after a fairly long uptrend.
2. The three peaks should be at nearly the same resistance level.
3. Entry of short position is only done if the price successfully breaks through the support (neckline).
4. Stop loss should be placed around the third peak to anticipate false breakouts.
5. The price target is usually calculated from the distance between the neckline and the peak, then projected downwards.
Read Also: 4 Meme Coins with the Highest Market Cap: DOGE, SHIB, PEPE, PENGU
Conclusion
The triple top pattern is a powerful trend reversal pattern in technical analysis. By understanding this pattern, traders can identify signs of weakening in an uptrend and anticipate a potential downtrend.
However, this pattern still needs to be confirmed with additional analysis, such as trading volume and other technical indicators, to make more accurate trading decisions.

How to Buy Crypto on Bittime
Want to trade sell and buy Bitcoins and easy crypto investing? Bittime is here to help! As an Indonesian crypto exchange officially registered with Bappebti, Bittime ensures every transaction is secure and fast.
Start by registering and verifying your identity, then make a minimum deposit of IDR 10,000. After that, you can immediately purchase your favorite digital assets!
Check the course BTC to IDR, ETH to IDR, SOL to IDR and other crypto assets to find out today's crypto market trends in real-time on Bittime.
Additionally, visit Bittime Blog to get various interesting updates and educational information about the world of crypto. Find trusted articles on Web3, blockchain technology, and digital asset investment tips designed to enrich your crypto knowledge.
FAQ
What is the difference between a triple top and a double top?
A double top has only two resistance peaks, while a triple top has three peaks that fail to break through. Triple tops are considered to provide a stronger signal.
Does a triple top always indicate a price drop?
Not always. Sometimes the price can break through resistance after the third attempt. Therefore, confirmation through a support break is crucial.
What indicators can be used with the triple top pattern?
Traders can use volume indicators, RSI, or MACD to strengthen the validation of this pattern.
Does triple top only happen in stocks?
No. This pattern can appear in all financial instruments that use price charts, including forex and crypto.
How to reduce risk when trading with triple top?
Use a stop loss around the third peak, don't rush into entry before confirmation, and combine it with other technical analysis.
Disclaimer: The views expressed belong exclusively to the author and do not reflect the views of this platform. This platform and its affiliates disclaim any responsibility for the accuracy or suitability of the information provided. It is for informational purposes only and not intended as financial or investment advice.

.png)