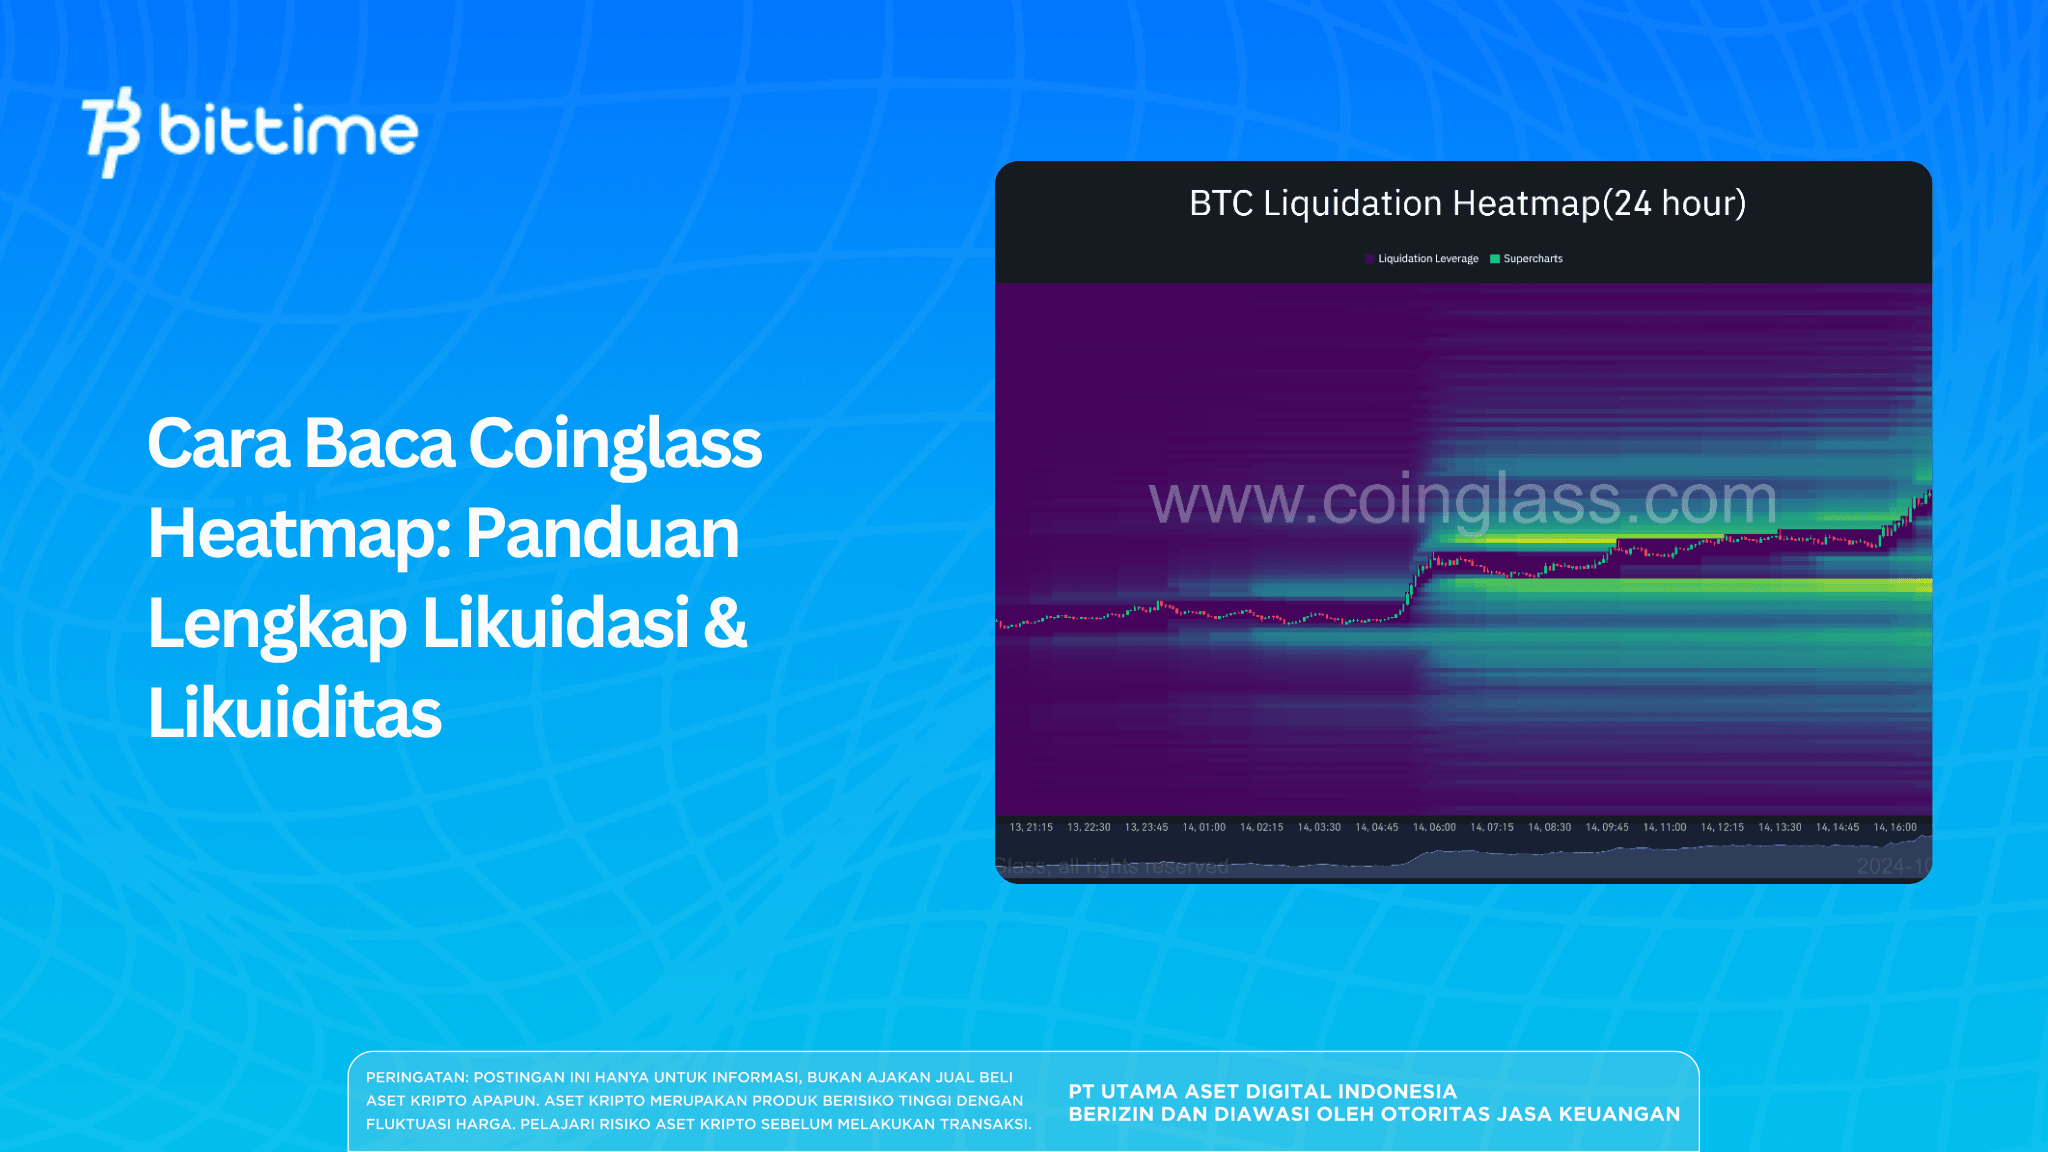
How to Read the Coinglass Heatmap: A Guide to Liquidations, Magnet Zones, and the RSI Heatmap
The Coinglass heatmap has become one of the most referenced tools among professional crypto traders — and for good reason.
It layers two critical datasets into a single color-coded chart: where liquidation pressure is concentrated, and where market order activity is densest. The result is a visual map that, when read correctly, reveals price "magnets" invisible on standard candlestick charts.
2026-10-15Read