Bitcoin Price in 2011: From $1 Parity to $31 Peak — Then a 93% Crash
2026-05-08
If you want to understand why Bitcoin (BTC) behaves the way it does — the violent rallies, the gut-wrenching crashes, and the stubborn recoveries — 2011 is where that story truly begins.
That year, Bitcoin's price history was written in the most extreme terms imaginable for a nascent asset: a 100x run from the start of the year, a first-ever record high of $31, and then a collapse of more than 93% that left many convinced the whole experiment was finished. It wasn't.
Understanding Bitcoin in 2011 means understanding the template for every cycle that followed, right up to Bitcoin's all-time highs above $120,000 in 2025.
Key Takeaways
- Bitcoin achieved dollar parity — $1 per BTC — for the first time on February 9, 2011, celebrated by early adopters as a landmark moment.
- The Bitcoin price peaked at approximately $31 on Mt. Gox in June–July 2011, before crashing more than 93% to around $2 by November due to the Mt. Gox hack and resulting panic selling.
- The 2011 boom-and-bust cycle established a pattern that has repeated in every major Bitcoin market cycle since — steep rise, severe correction, and eventual recovery to new highs.
Register on Bittime now and start trading crypto with a fast, secure, and easy process on the app.
Before 2011: Bitcoin Had No Price
Understanding just how remarkable 2011 was requires a brief look at what came before.
Satoshi Nakamoto published the Bitcoin whitepaper on October 31, 2008, and the network went live with the mining of the genesis block on January 3, 2009. For roughly two years after launch, Bitcoin had no organized market price whatsoever.
The first publicly recorded exchange rate appeared on October 5, 2009, when New Liberty Standard set Bitcoin's value at 1,309.03 BTC per dollar — meaning one Bitcoin was worth less than a tenth of a cent. Coins were sent between cryptography enthusiasts largely as a curiosity, not a currency.
The most famous early transaction came on May 22, 2010, when programmer Laszlo Hanyecz paid 10,000 BTC for two pizzas worth approximately $40. At Bitcoin's peak prices in 2025, those coins would be worth well over a billion dollars. Throughout 2010, the price crept from $0.003 to $0.08, never clearing $0.40 for the entire year.
Bitcoin in 2011: The First Real Bull Market
February: Dollar Parity
On February 9, 2011, Bitcoin hit $1.00 for the first time. The Bitcoin Talk forums lit up — users called it a reason to throw "parity parties," celebrating the moment a single coin equaled a single dollar. To the outside world this was a trivial figure, but inside the community it was proof that Bitcoin could function as a legitimate unit of account.
What drove the move? Several things converged at once. Mainstream media coverage picked up meaningfully for the first time. New exchanges were entering the market, improving liquidity and access.
Tech enthusiasts, libertarians, and early investors began to genuinely engage with Bitcoin as something beyond a hobbyist experiment — a decentralized alternative to government-controlled currencies.
May–June: The Parabolic Run to $31
From $1, the acceleration was striking. By May 2011, Bitcoin had already surpassed $8 — more than a 25x return from the year's opening price of around $0.30. The momentum continued, driven by growing media attention and an expanding user base.
In June 2011 — with some records placing the exact peak on July 8 — Bitcoin hit approximately $31 on Mt. Gox, the dominant exchange of the era handling roughly 70% of all global Bitcoin transactions. That represented a rise of more than 100x from the beginning of the year alone.
The drivers of this surge were clear in retrospect. Growing mainstream exposure brought in new buyers faster than infrastructure could handle. Bitstamp was founded in 2011 as a more stable alternative to Mt. Gox, signaling that the market was maturing.
The Electronic Frontier Foundation (EFF) briefly accepted Bitcoin donations. And the fundamental narrative — money outside government control — was proving resonant.
July–December: The First Major Crash
The peak didn't hold. Almost immediately after reaching $31, the price began unraveling. The primary trigger was a major security breach at Mt. Gox: user data was compromised, trust evaporated, and panic selling set in across the limited liquidity market that existed at the time.
By November 2011, Bitcoin had fallen to approximately $2 — a collapse of more than 93% from its June peak. The year closed with Bitcoin trading around $4.70, with many commentators declaring the experiment dead.
The crash followed a pattern that would repeat itself in 2013, 2017, 2021, and beyond: speculative demand outruns adoption, a triggering event breaks confidence, and the price corrects violently. But each time, Bitcoin found a new floor higher than the one before.
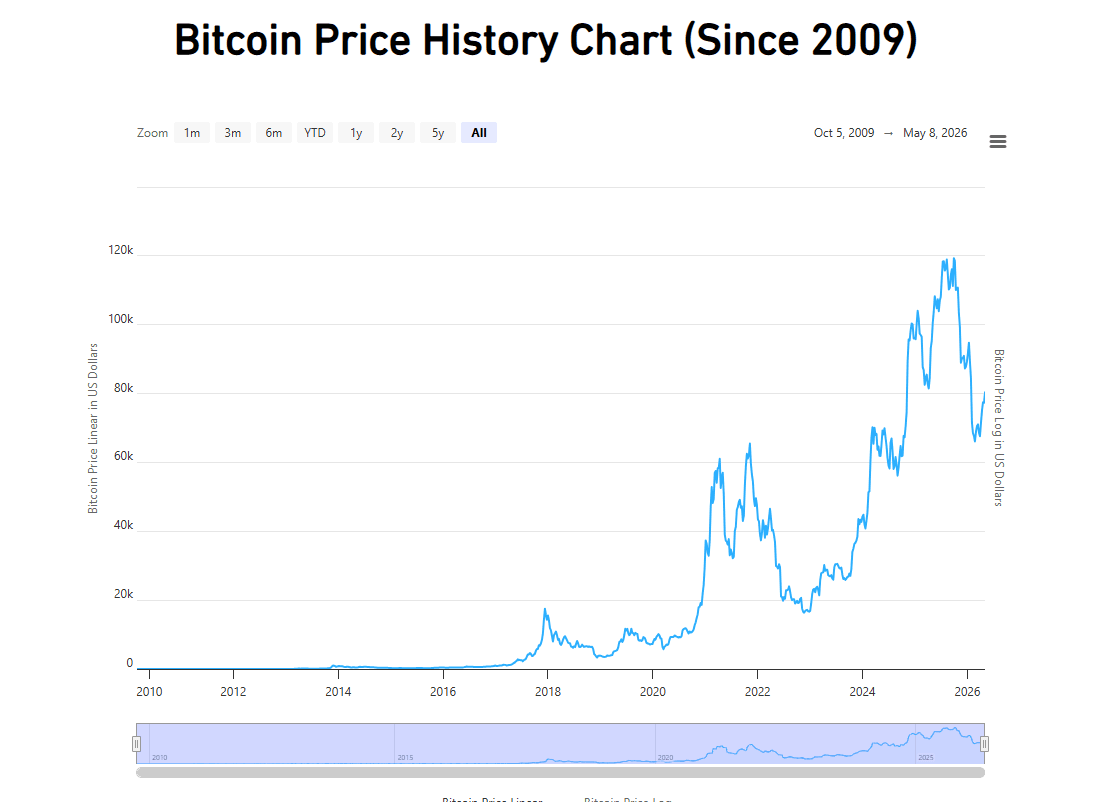
Bitcoin Price History: From 2012 to ATH Above $120,000
Placing 2011 in the full sweep of Bitcoin price history makes its significance even clearer.
2012: After the crash, Bitcoin traded quietly between $4 and $13. In November, the first halving cut the mining reward from 50 BTC to 25 BTC per block — a supply shock that historically precedes major price movements.
2013: The first major institutional moment. Bitcoin surged from $13 at the start of the year to $266 in April, then to $1,242 by November 29, 2013 — a year of over 8,000% gains.
2014–2015: The Mt. Gox collapse dragged prices back to the $200s. Recovery was slow but steady.
2017: Bitcoin's first mainstream moment. It broke $1,000, $10,000, and peaked at nearly $20,000 in December — a 20x rise in under 12 months that brought global headlines.
2018–2019: A deep correction bottomed near $3,200 in December 2018 before gradual recovery.
2020: COVID-19 caused a violent crash to $3,800 in March ("Black Thursday"), but Bitcoin recovered to close the year at $29,000 — a new all-time high.
2021: Bitcoin surpassed $60,000 for the first time in March and recorded an ATH of $67,549 in November, before another correction.
2022: The collapse of FTX and broader contagion drove Bitcoin to a low of $15,479 — a bear market lasting well into 2023.
2023: A recovery year. Bitcoin climbed from $16,000 at the start to $43,000 by December, posting roughly 180% gains.
2024: Two historic events defined the year: the approval of spot Bitcoin ETFs in the U.S. in January, and the fourth halving in April. In November, fueled by Donald Trump's presidential election victory, Bitcoin broke $100,000 for the first time in history, peaking at $103,804.
2025: Record after record. Bitcoin hit $109,079 in January (hours before Trump's inauguration), then $111,679 in May, $120,781 in July, and an all-time high of $124,752 in October 2025 — more than 4,000 times its 2011 peak.
2026: Bitcoin began the year trading between $87,000 and $88,000.
Conclusion
Bitcoin in 2011 was the first proof of concept for what the asset would become: capable of extraordinary gains, capable of catastrophic losses, and capable of surviving both.
The year answered the question how much was Bitcoin in 2011 with numbers that feel almost absurd in retrospect — $0.30 to $31, then back to $2 — and yet those numbers set the template for everything that followed.
Every boom-and-bust cycle since has rhymed with 2011: parabolic run, brutal correction, recovery to new highs. The difference is scale. What was once a $31 peak is now a $124,000 floor in the making. For anyone studying Bitcoin price history, 2011 isn't ancient history — it's the user manual.
FAQ
How much was Bitcoin worth in 2011? Bitcoin opened 2011 at approximately $0.30, reached $1 in February, surged to a then-ATH of around $31 in June–July, then fell back to roughly $2 by November and closed the year near $4.70.
When did Bitcoin first hit $1? Bitcoin first reached $1.00 on February 9, 2011 — a milestone that the early community celebrated as achieving parity with the US dollar for the first time.
Why did Bitcoin crash after hitting $31 in 2011? The primary cause was a major hack of the Mt. Gox exchange, which controlled approximately 70% of global Bitcoin trading volume at the time. The breach destroyed user confidence and triggered panic selling that drove the price down more than 93% from its peak.
What was Bitcoin's all-time high in 2011? Bitcoin's all-time high in 2011 was approximately $31, recorded on Mt. Gox around June–July 2011. It was the highest price ever reached at that point in Bitcoin's history before the subsequent crash.
How does Bitcoin's 2011 price compare to today? Bitcoin's 2011 peak of $31 is a fraction of its current levels. By October 2025, Bitcoin's all-time high had reached $124,752 — roughly 4,000 times its 2011 record, representing one of the most extreme asset appreciation stories in financial history.
What events drove Bitcoin's price up in 2011? Three key factors: a surge in mainstream media coverage bringing new buyers, the expansion of exchange infrastructure improving market access, and growing recognition of Bitcoin's narrative as decentralized, government-independent money among technologists and early investors.
What is a Bitcoin halving and how does it affect price? A halving is an event, occurring roughly every four years, where the Bitcoin block reward for miners is cut in half. The first halving happened in November 2012, reducing the reward from 50 to 25 BTC. Historically, each halving has preceded a significant price rally in the 12 to 18 months that follow — a pattern that has held through all four halvings to date.
How to Buy Crypto on Bittime?

Want to trade sell buy Bitcoins and crypto investment easily? Bittime is here to help! As an Indonesian crypto exchange officially registered with Bappebti, Bittime ensures every transaction is safe and fast.
Start with registration and identity verification, then make a minimum deposit of IDR 10,000. After that, you can immediately buy your favorite digital assets!
Check the exchange rate BTC to IDR, ETH to IDR, SOL to IDR and other crypto assets to find out today's crypto market trends in real-time on Bittime.
Also, visit the Bittime Blog for interesting updates and educational information about the crypto world. Find reliable articles about Web3, blockchain technology, and digital asset investment tips designed to enrich your crypto knowledge.
Disclaimer: The views expressed belong exclusively to the author and do not reflect the views of this platform. This platform and its affiliates disclaim any responsibility for the accuracy or suitability of the information provided. It is for informational purposes only and not intended as financial or investment advice.

.png)