Bitcoin Horror Prediction for May 2026: Sweet Pump or Deadly Dump Awaits?
2026-05-28
Bittime - Bitcoin at the end of May 2026 is at a crossroads. The BTC price is currently hovering around $76,000, caught between bullish expectations and bearish threats.
Two contrasting scenarios await: a sweet pump to $82,000, or a deadly dump to $65,000.
This horror prediction for Bitcoin May 2026 will examine both possibilities based on technical analysis, whale behavior, and market structure.
Key Points
Bitcoin fails to break through $82K resistance– Currently holding at $75K-$76K support. The market structure remains bearish.
Potential short squeeze to $80K-$82K– The large liquidity above could trigger a temporary pump before the next dump.
Risk of correction to $65K-$66K– If the $75K support breaks and long-term holders start distributing.
Register at Bittime now and start trading crypto with a fast, safe, and easy process in the app.
Sweet Pump Scenario: Short Squeeze to $82K
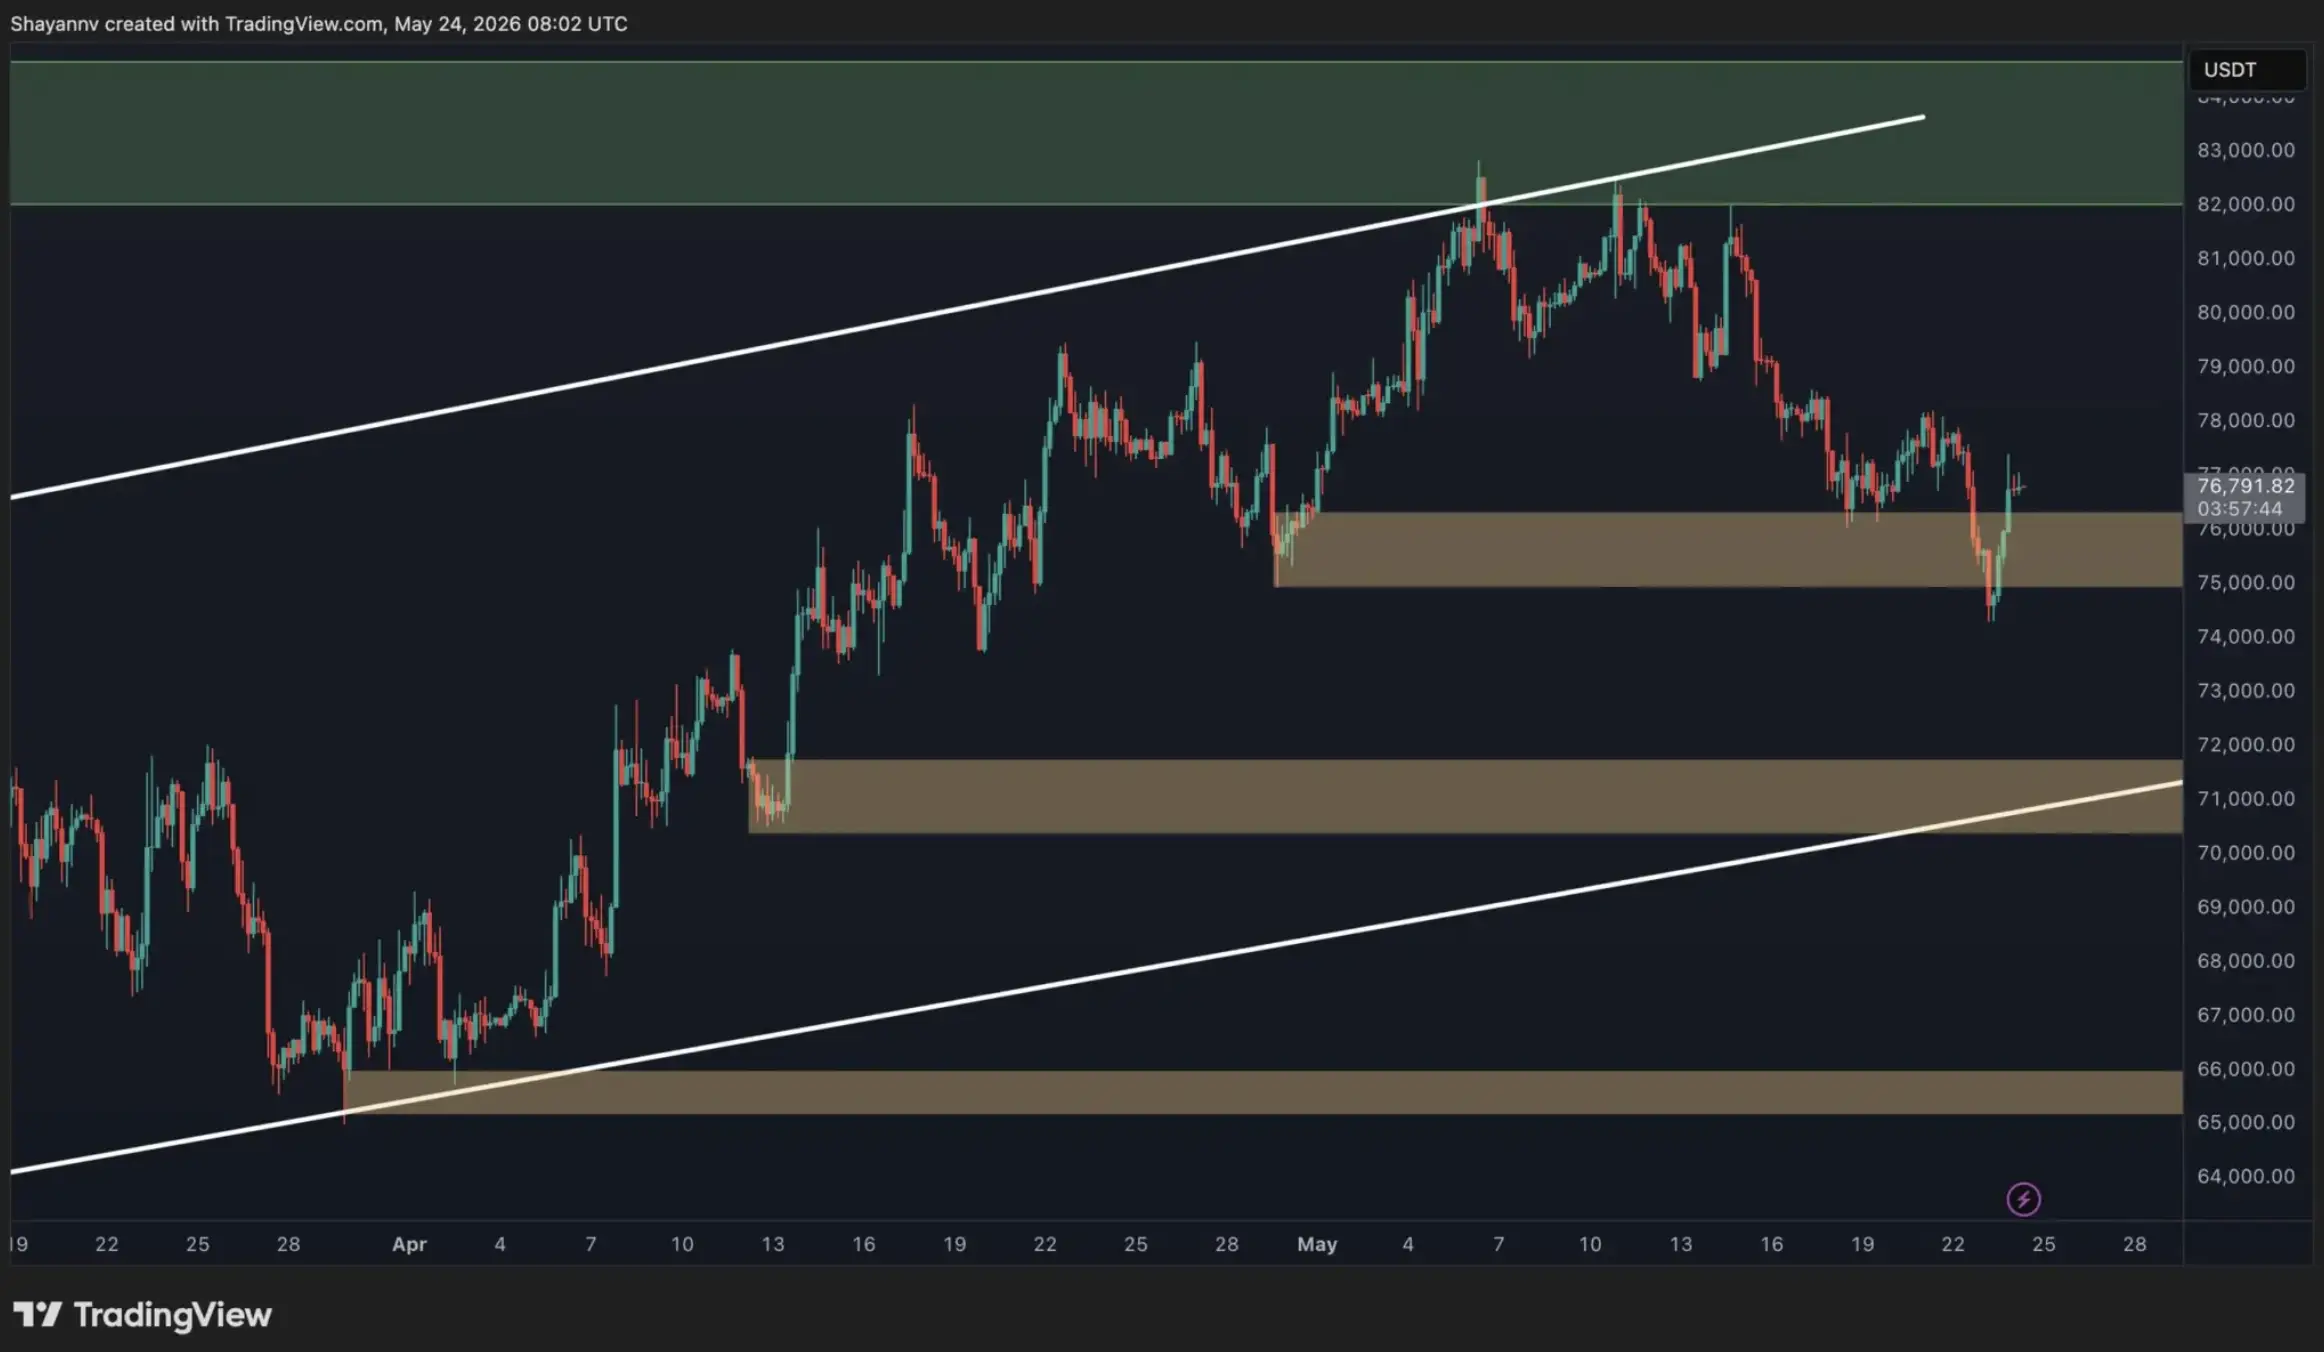
Bitcoin still offers a strong potential for a pump in May 2026. Analysts see indications of active buyers absorbing selling pressure in the $75,000 to $76,000 area.
The price briefly broke through support and then quickly rose again, a pattern often seen as an attempt to gain liquidity.
Source: TradingView | CryptoPotato
On the 4-hour timeframe, BTC is starting to show signs of short-term recovery. After bouncing off the $75,000 order block, BTC is now consolidating.
If buying momentum continues, the nearest upside targets are $78,000-$79,000, then $80,000-$82,000.
The $80K-$82K zone is considered a large liquidity area filled with short positions of leveraged traders.
The market often moves to this area to liquidate short positions before continuing the main trend.
This scenario is called a short squeeze:prices rise rapidly, short traders are forced to buy back in, and prices are pushed up more aggressively.
The BTC resistance level of 82,000 is a key level. If it is successfully broken, Bitcoin could potentially reach a new all-time high.
Bearish Signal: EMA Breach and 35% Crash Risk
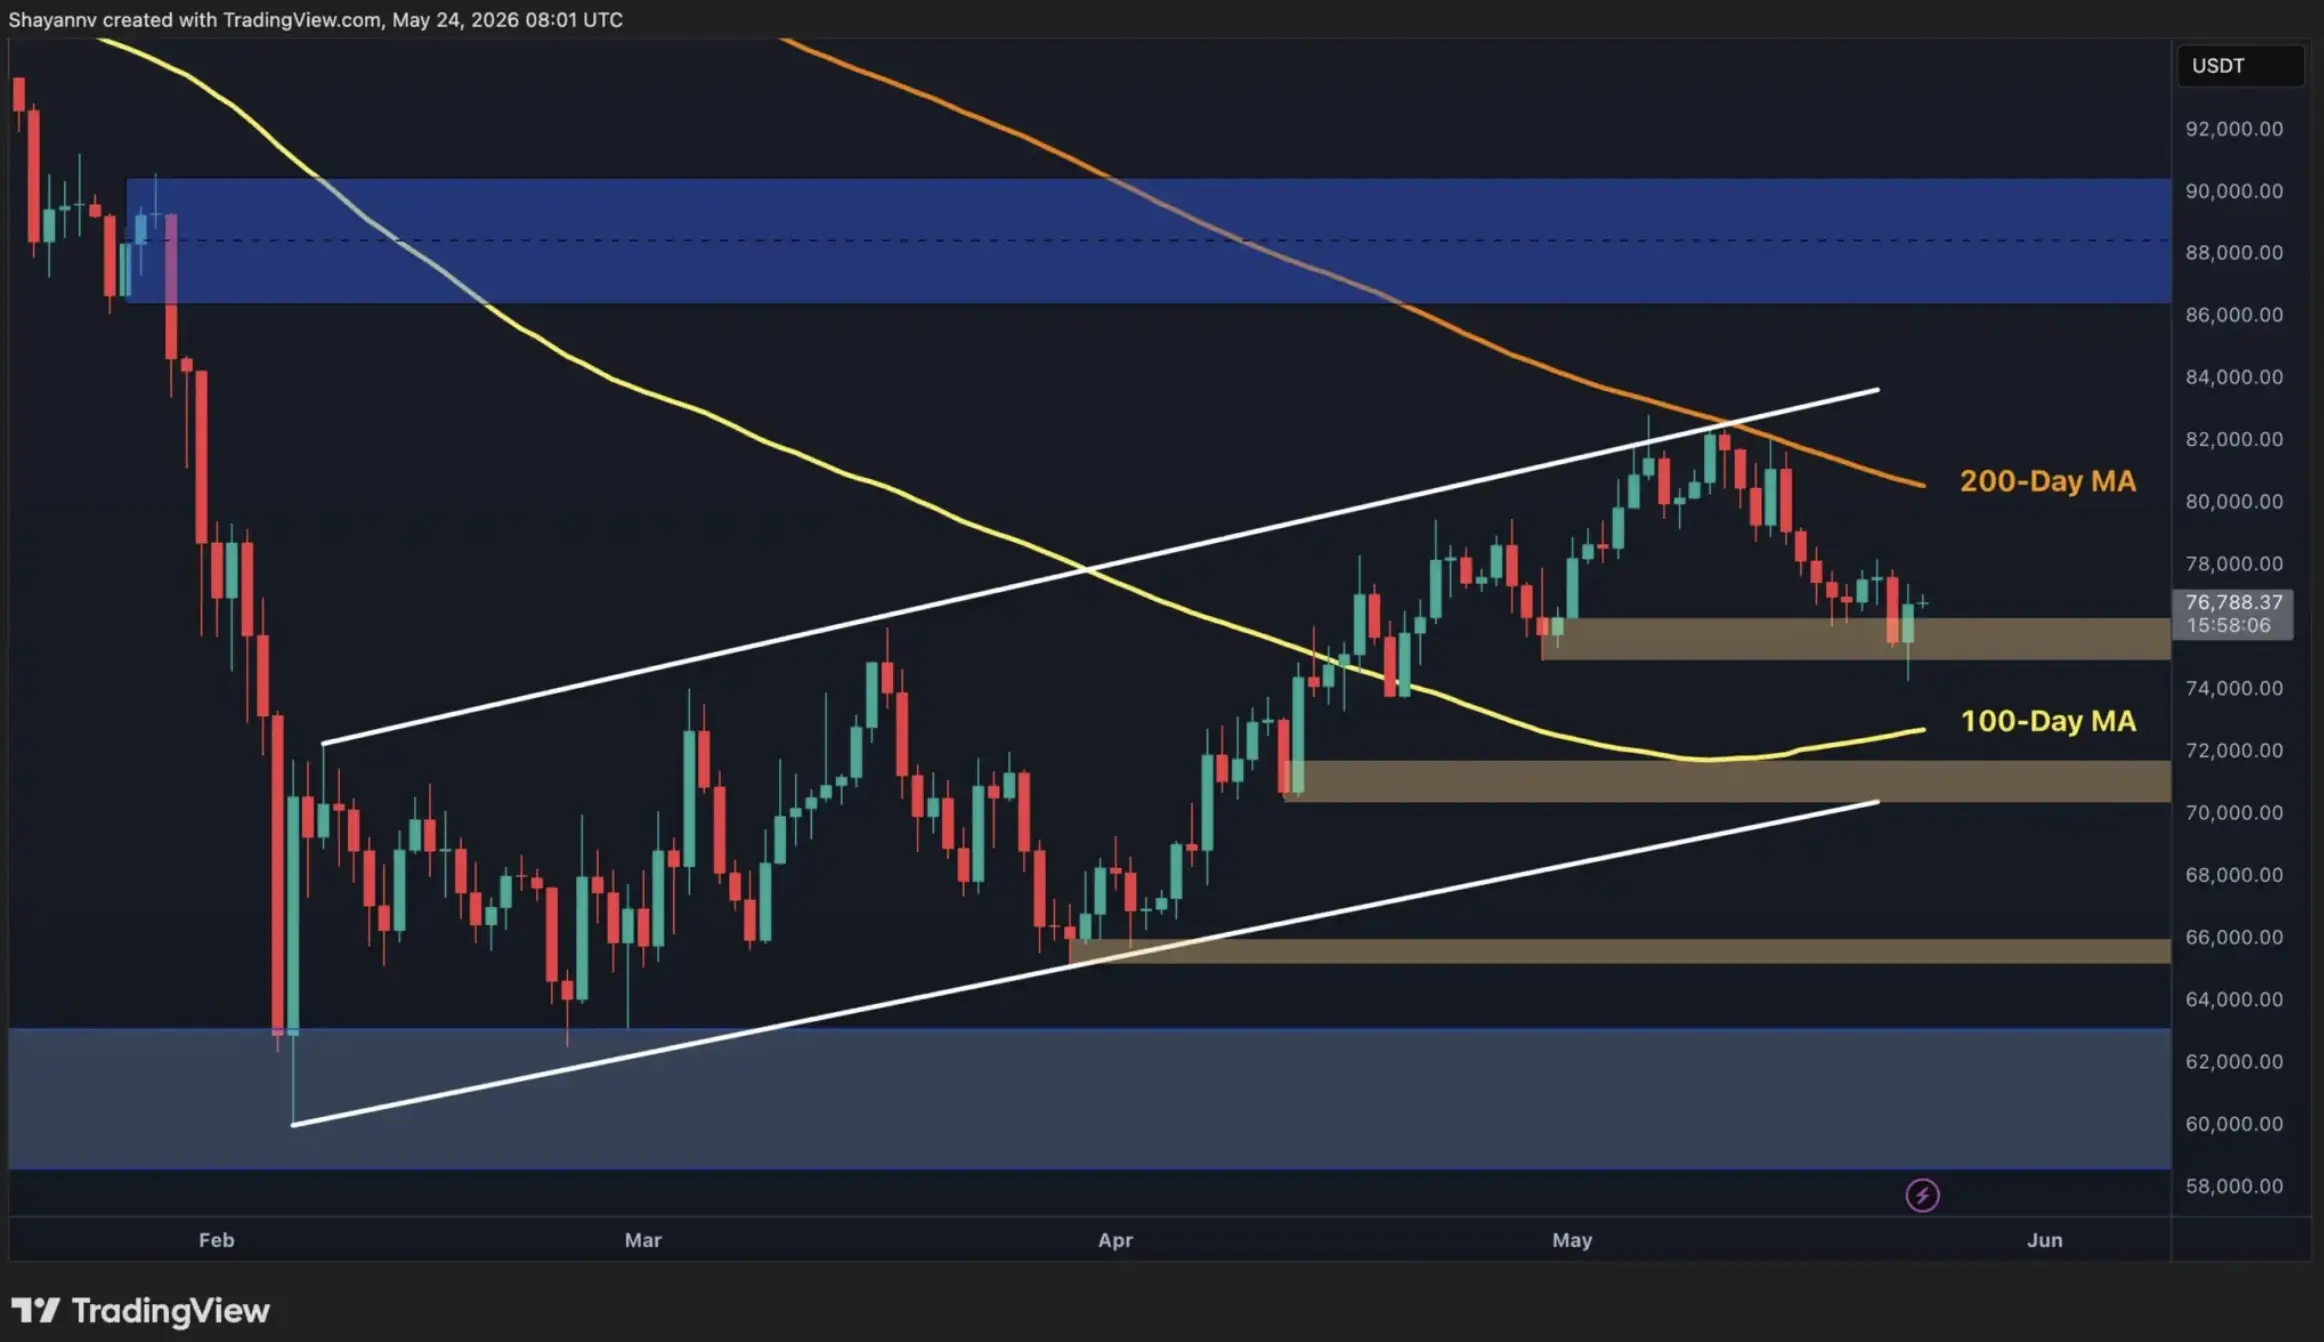
However, Bitcoin price predictions should also include concerning bearish signals. Bitcoin's price is currently below all four major Exponential Moving Averages (EMAs) on the daily chart.
Source: TradingView | CryptoPotato
Data from shows:
- 20-day EMA: $77.428
- 50-day EMA: $76.677
- 100-day EMA: $76.812
- 200-day EMA: $81.367
Bitcoin has completely broken through all four EMAs three times in 2026. The results have varied widely.
The first incident in late January triggered a 35% crash to the $60,000s.
However, the next two events (March and May) only resulted in a correction of 3-7%.
What makes the difference? Long-term holder behavior.
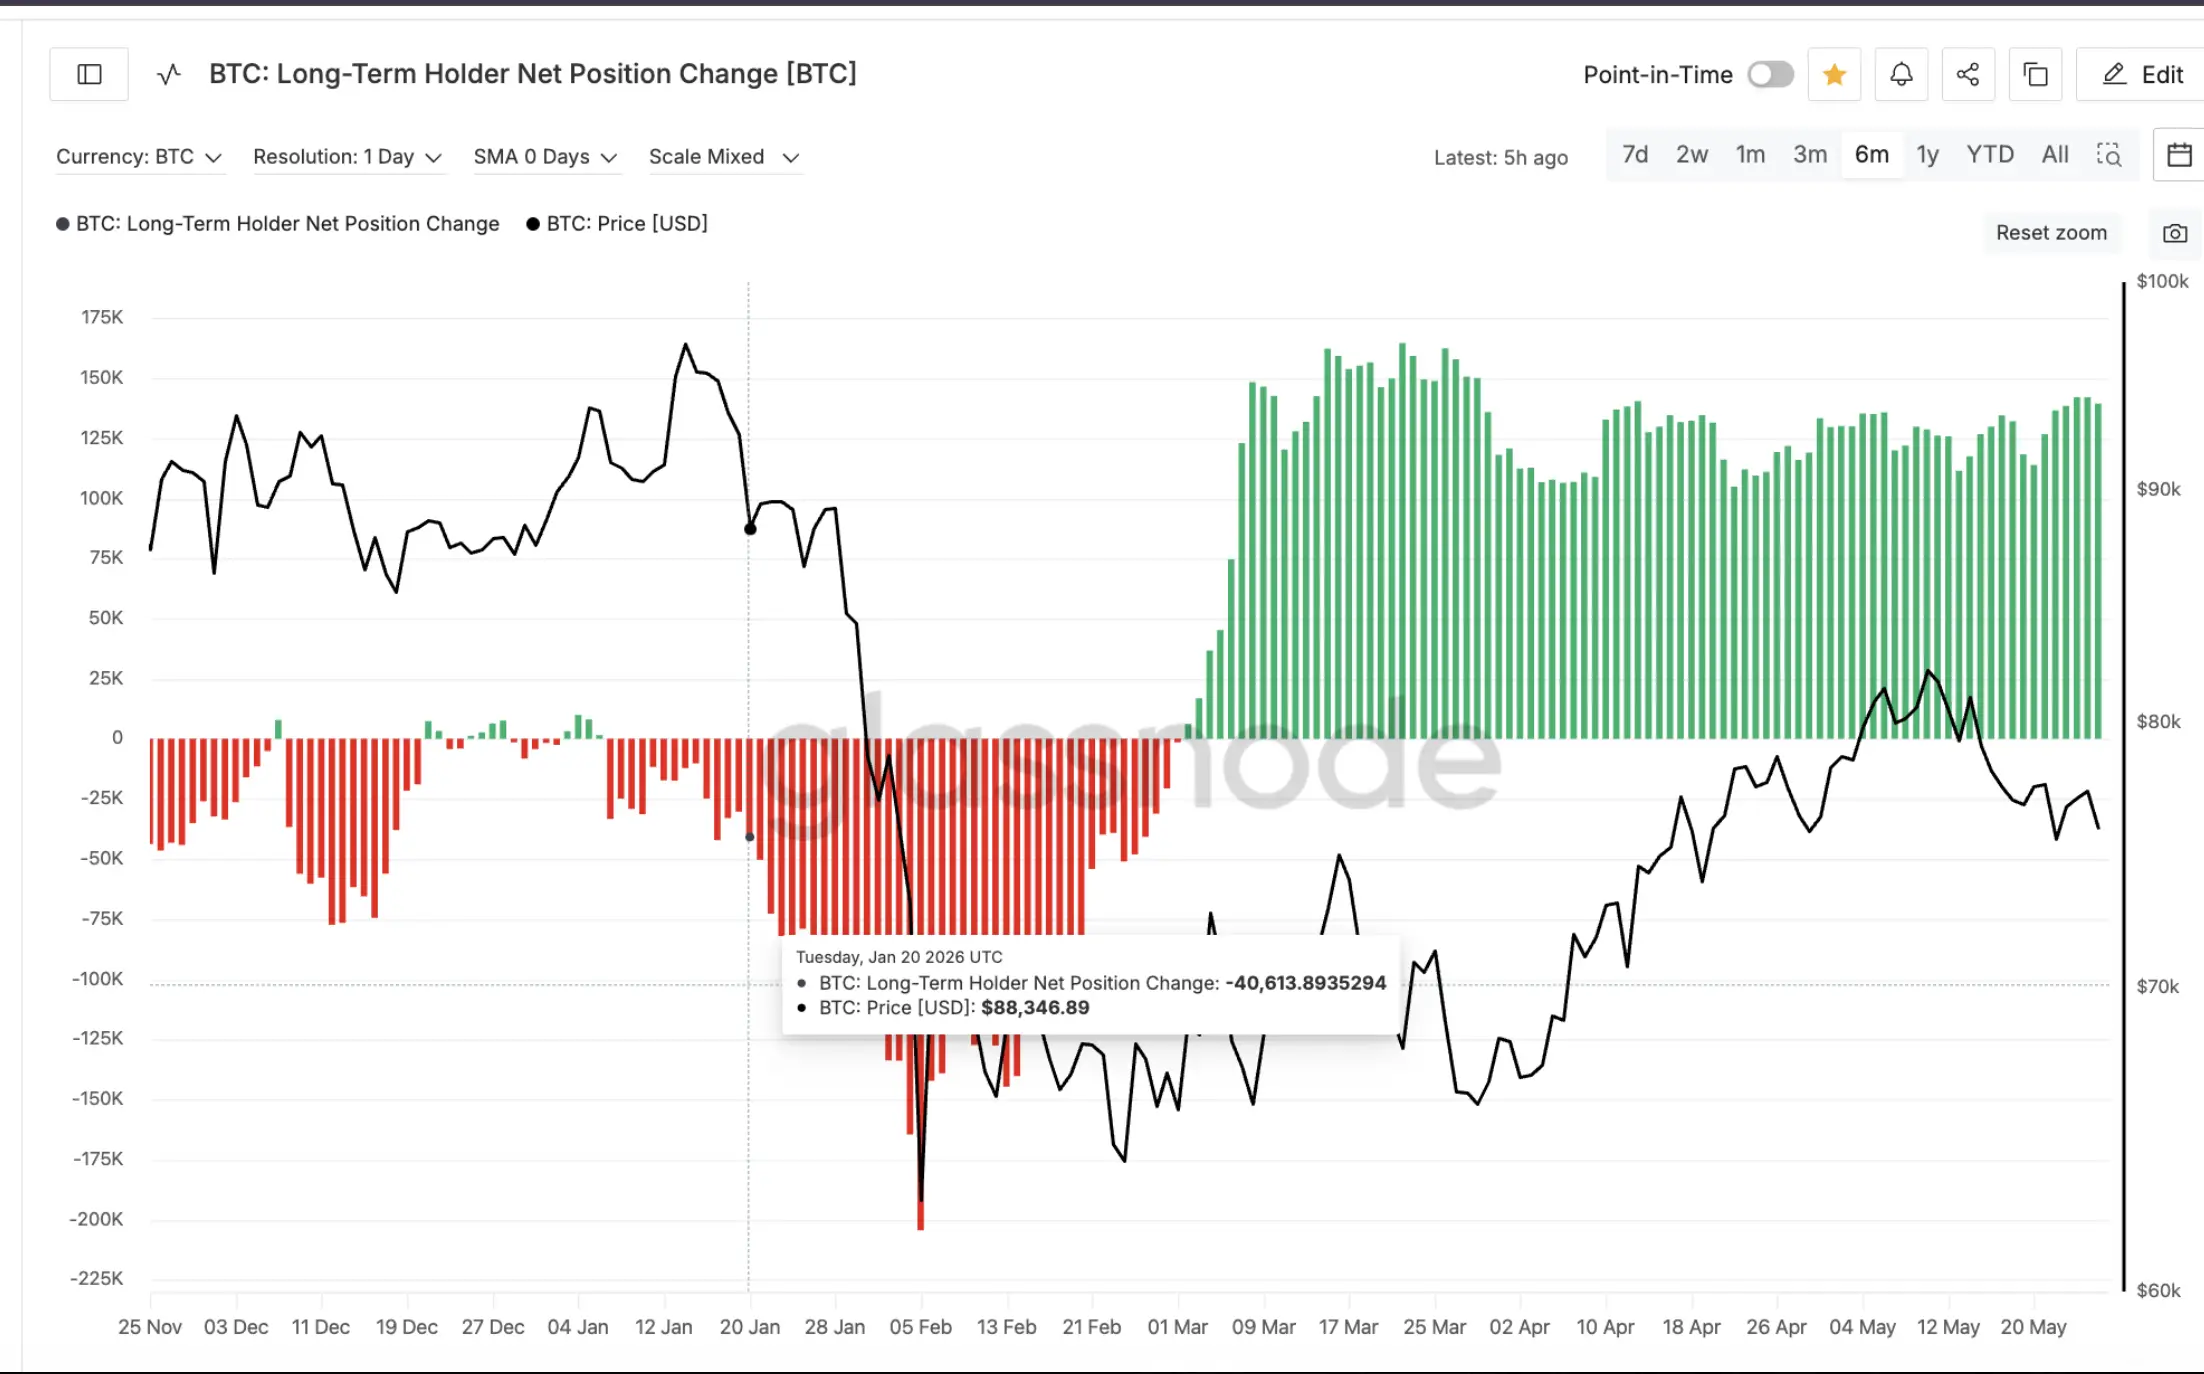
Glassnode's BTC technical analysis shows that in January, long-term holders became massive net sellers.
The red bar on the chart reached around -200,000 BTC. This simultaneous selling turned a normal EMA breakout into a 35% crash.
Since early March, long-term holders have continued to accumulate. This coincided with a milder decline in March and May.
Currently, long-term holders remain in accumulation territory. If this condition persists, a decline of only 3-7% to $73,800-$71,700 is likely.
However, the risk of BTC falling to 65k remains if long-term holders start distributing.
Read also:Crypto Converter 1 BTC to IDR
Whales Still Buying: Contradictory Signals
Amid the uncertainty, a whale withdrew 873 BTC worth $66 million from OKEx.
This action occurred just as Bitcoin lost all of its EMAs. This whale now holds 881 BTC.
This suggests at least one major player saw a buying opportunity, likely betting that this scenario would mimic March and May (a mild correction), not January (a major crash).
The BTC pump dump depends heavily on whether long-term holders continue to accumulate or start distributing.
Start trading BTC/IDR with Bittime here!
Deadly Dump Scenario to $65K
If Bitcoin fails to hold the $75,000-$76,000 support, renewed selling pressure is predicted to bring the price down to:
- $70.000 - $71.000
- $65,000 - $66,000 (worst level)
Analysts also highlighted the presence of a large pool of liquidity below the market, specifically in the range of $60,000 to $63,000.
Areas with high liquidity often become price magnets because the market tends to move towards zones with many leveraged positions.
Bitcoin's bearish outlook for 2026 will be confirmed if BTC fails to reclaim the $80,000-$82,000 zone. The current rally is considered only a temporary relief rally.
Read also:How to Buy Bitcoin (BTC)
BTC Price Key Levels to Monitor
Resistance:
- $78,000 - $79,000 (nearest target)
- $80.000 - $82.000 (zona short liquidation, kunci bullish)
Support:
- $75,000 - $76,000 (current holding zone)
- $73,800 (0.5 Fibonacci, 3-4% correction)
- $71,700 (0.618 Fibonacci, 6-7% correction)
- $65,000 - $66,000 (worst case scenario)
Bullish confirmation:The daily close was above $75,973, then $78,572, and finally $82,772.
Conclusion
The horror predictions for Bitcoin in May 2026 present two contrasting scenarios. A sweet pump to $82,000 is still possible through a short squeeze, especially if long-term holders continue accumulating and the $66 million whale proves to be well-positioned.
But a deadly dump to $65,000 also lurks.
If Bitcoin fails to hold the $75,000 support, and if long-term holders turn sellers as they did in January, a deep correction could occur.
Bitcoin end of May 2026 will determine the market direction for the following weeks.
Whatever the scenario, extreme volatility is a certainty.

This level of Bitcoin volatility indicates that the crypto market is still heavily influenced by sentiment, whale activity, and short-term technical momentum.
Bittime is a licensed and regulated Digital Financial Asset Trader (PAKD) supervised by Indonesia’s Financial Services Authority (OJK) — where you can buy Bitcoin in Indonesia and hundreds of other crypto assets starting from just Rp10,000. The registration process is fast, secure, and you can get started today.
Track USDT to IDR conversions and monitor your favorite crypto assets in real time. Everything is available in one crypto investment app that you can download for free on the Play Store
Ready to start? Register now on Bittime and execute your investment strategy with a platform trusted by millions of users in Indonesia.
FAQ
What is the Bitcoin prediction for the end of May 2026?
Two scenarios: pump to $80K-$82K (short squeeze) or dump to $70K or even $65K.
What is a short squeeze in Bitcoin?
When the price rises rapidly, short traders are forced to buy back, pushing the price higher.
Why could Bitcoin drop to $65K?
If the $75K support breaks and long-term holders start distributing as in January, the risk of a 35% correction is open.
What does EMA breach mean?
Bitcoin lost all major EMAs (20, 50, 100, and 200). In January, this triggered a 35% crash. In March and May, it only experienced a 3-7% correction.
What makes January different from March/May?
Long-term holder behavior. In January, they sold heavily. In March and May, they accumulated.
Disclaimer: The views expressed belong exclusively to the author and do not reflect the views of this platform. This platform and its affiliates disclaim any responsibility for the accuracy or suitability of the information provided. It is for informational purposes only and not intended as financial or investment advice.

.png)