Hivemapper (HONEY) Long-Term Price Prediction: Fundamental and Technical Analysis for Investors
2025-11-28
Bittime - Hivemapper and the HONEY token are back in the news after price fluctuations seen on the latest price charts.
Long-term Hivemapper price predictions require a two-pronged approach: understanding the mechanics of the HONEY token along with the on-chain factors driving demand, and then reviewing price behavior on recent charts to formulate realistic scenarios.
In this article, we combine official tokenomics data, recent market movements, and technical observations from the attached charts to create a balanced and easy-to-follow estimate.
Summary of current market conditions
At the time of writing, HONEY is trading around one cent USD, with its capitalization and circulating supply recorded on several major sources.
Market sources indicate a price of around $0.01 per HONEY and a circulating supply of around 5.17 to 5.18 billion tokens, with daily volume fluctuations affecting short-term volatility.
Global exchanges and price data boards show slight variations between platforms, but the consensus market value remains around one cent per token. Hivemapper's official statement also confirms that HONEY operates on the Solana network and has clear economic parameters.
Fundamental factors that influence the price of HONEY
There are three fundamental pillars that determine HONEY's long-term direction. First, token utility, which is how widely Hivemapper map data is used by developers and companies, as data consumption burns tokens.
The second is a burn and mint scheme which stipulates that most of the HONEY burned when data is consumed is not returned, while a small portion is rewarded to contributors according to rules set by the governance proposal.
Third, contributor adoption through a drive-to-earn program, where data providers receive HONEY in return. These three pillars directly link token demand to actual network usage.
Changes in the number of data consumers, burn rates, or distribution policies can accelerate or restrain price pressures.
HONEY technical analysis
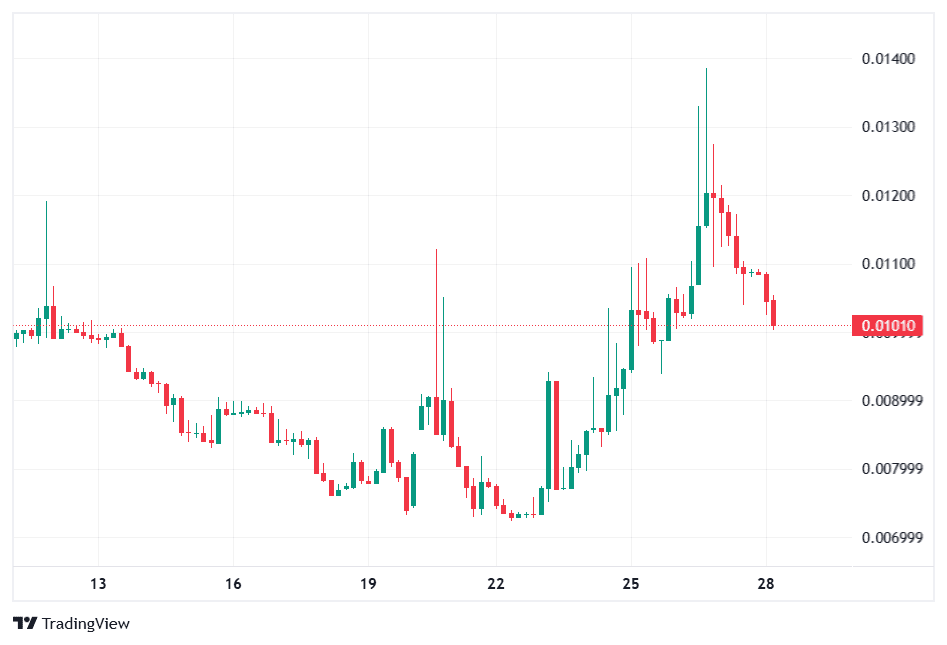
Based on the attached chart, Hivemapper (HONEY) token is showing a recovery pattern after a period of consolidation. It shows a brief price spike to a local high, followed by a correction back to the support level around $0.008 to $0.010.
Volume on the bullish candle indicates increased buying interest while the subsequent correction appears to occur with high volatility.
Technically, if HONEY is able to maintain the current support level, the upside target could potentially be towards the local resistance recorded at the nearest peak around $0.013 to $0.014.
Conversely, if support breaks, the next area to watch is around $0.006 to $0.007, based on recent price structure. This analysis combines candlestick observations, support and resistance levels, and the risk-to-reward ratio.
Long-term prediction scenario
Long-term forecasts should be presented as scenarios. A conservative scenario assumes moderate adoption and relatively stable data demand, which would place HONEY in the average range of a few cents to tens of cents over 1 to 3 years if usage growth is slow.
The optimistic scenario assumes that corporate adoption and data consumption volumes increase rapidly, resulting in high token burn, which could drive further appreciation to several times the current price.
A pessimistic scenario occurs when adoption stagnates and supply is released regardless of token release restrictions, so the price could remain flat or fall further.
The opportunity for appreciation is directly proportional to how many commercial entities use Hivemapper services because that is the most direct source of demand for HONEY.
Key risks and position management strategies
Risks for HONEY holders include high crypto market volatility, reliance on map data adoption, and potential selling pressure from locked tokens that are then liquidated at the release schedule.
Furthermore, technical disruptions on Solana or issues with the data monetization pipeline could have a negative impact. Prudent management strategies include setting position sizes based on risk tolerance, using realistic stop-losses, and diversifying your portfolio.
For long-term investors, monitoring on-chain metrics like weekly burn rate and data consumption volume provides better signals than relying solely on price news.
Conclusion
Long-term Hivemapper price predictions can't be pinned on a single figure. HONEY has a fundamental economic mechanism that generates demand through burning data as it consumes and rewards contributors.
However, the final outcome depends heavily on commercial adoption and crypto market dynamics. Technical analysis on the latest charts suggests potential recovery if support is held, but also indicates the risk of a correction if buying momentum dissipates.
Investors in Indonesia considering HONEY should combine an understanding of official tokenomics, monitoring on-chain metrics, and rigorous risk management before opening a position.
FAQ
Is HONEY still worth buying for long-term investment?
Whether it's worth it depends on your investment goals and risk tolerance. HONEY offers an economic mechanism that ties token value to map data usage but doesn't guarantee price appreciation. Consider understanding the weekly burn rate, adoption roadmap, and appropriate position size.
What are the most important on-chain indicators to monitor?
Monitor the weekly burn rate, the number of Map Credits sold, the number of active contributors, and the transaction volume on the exchange. Changes in these metrics provide a clear indication of demand for network data.
How does listing on local exchanges affect the price of HONEY in Indonesia?
Listing on a local exchange can increase liquidity and accessibility, thus driving short-term retail demand. The long-term impact depends on whether the listing sparks sustained new user adoption.
Does the burn and mint policy reduce the risk of token inflation?
Burn and mint policies, particularly the implementation of the MIP, which burns a large portion of the tokens used for Map Credits, have a deflationary effect relative to supply. However, this effect is only significant if demand for the data is strong enough for the burning to be significant.
What data sources should I use to verify prices and supply?
Use data from leading aggregators like CoinMarketCap, CoinGecko, major exchanges, and the official Hivemapper documentation for tokenomics. For governance information and economic updates, please consult the official Hivemapper documentation.
.
How to Buy Crypto on Bittime

Want to trade sell buy Bitcoins and crypto investment easily? Bittime is here to help! As an Indonesian crypto exchange officially registered with Bappebti, Bittime ensures every transaction is safe and fast.
Start with registration and identity verification, then make a minimum deposit of IDR 10,000. After that, you can immediately buy your favorite digital assets!
Check the exchange rate BTC to IDR, ETH to IDR, SOL to IDR and other crypto assets to find out today's crypto market trends in real-time on Bittime.
Also, visit the Bittime Blog for interesting updates and educational information about the crypto world. Find reliable articles about Web3, blockchain technology, and digital asset investment tips designed to enrich your crypto knowledge.
Disclaimer: The views expressed belong exclusively to the author and do not reflect the views of this platform. This platform and its affiliates disclaim any responsibility for the accuracy or suitability of the information provided. It is for informational purposes only and not intended as financial or investment advice.

.png)