Gold Price Record and XAUT/IDR: Gold Breaks $5,000, What Does This Mean for Investors?
2026-01-27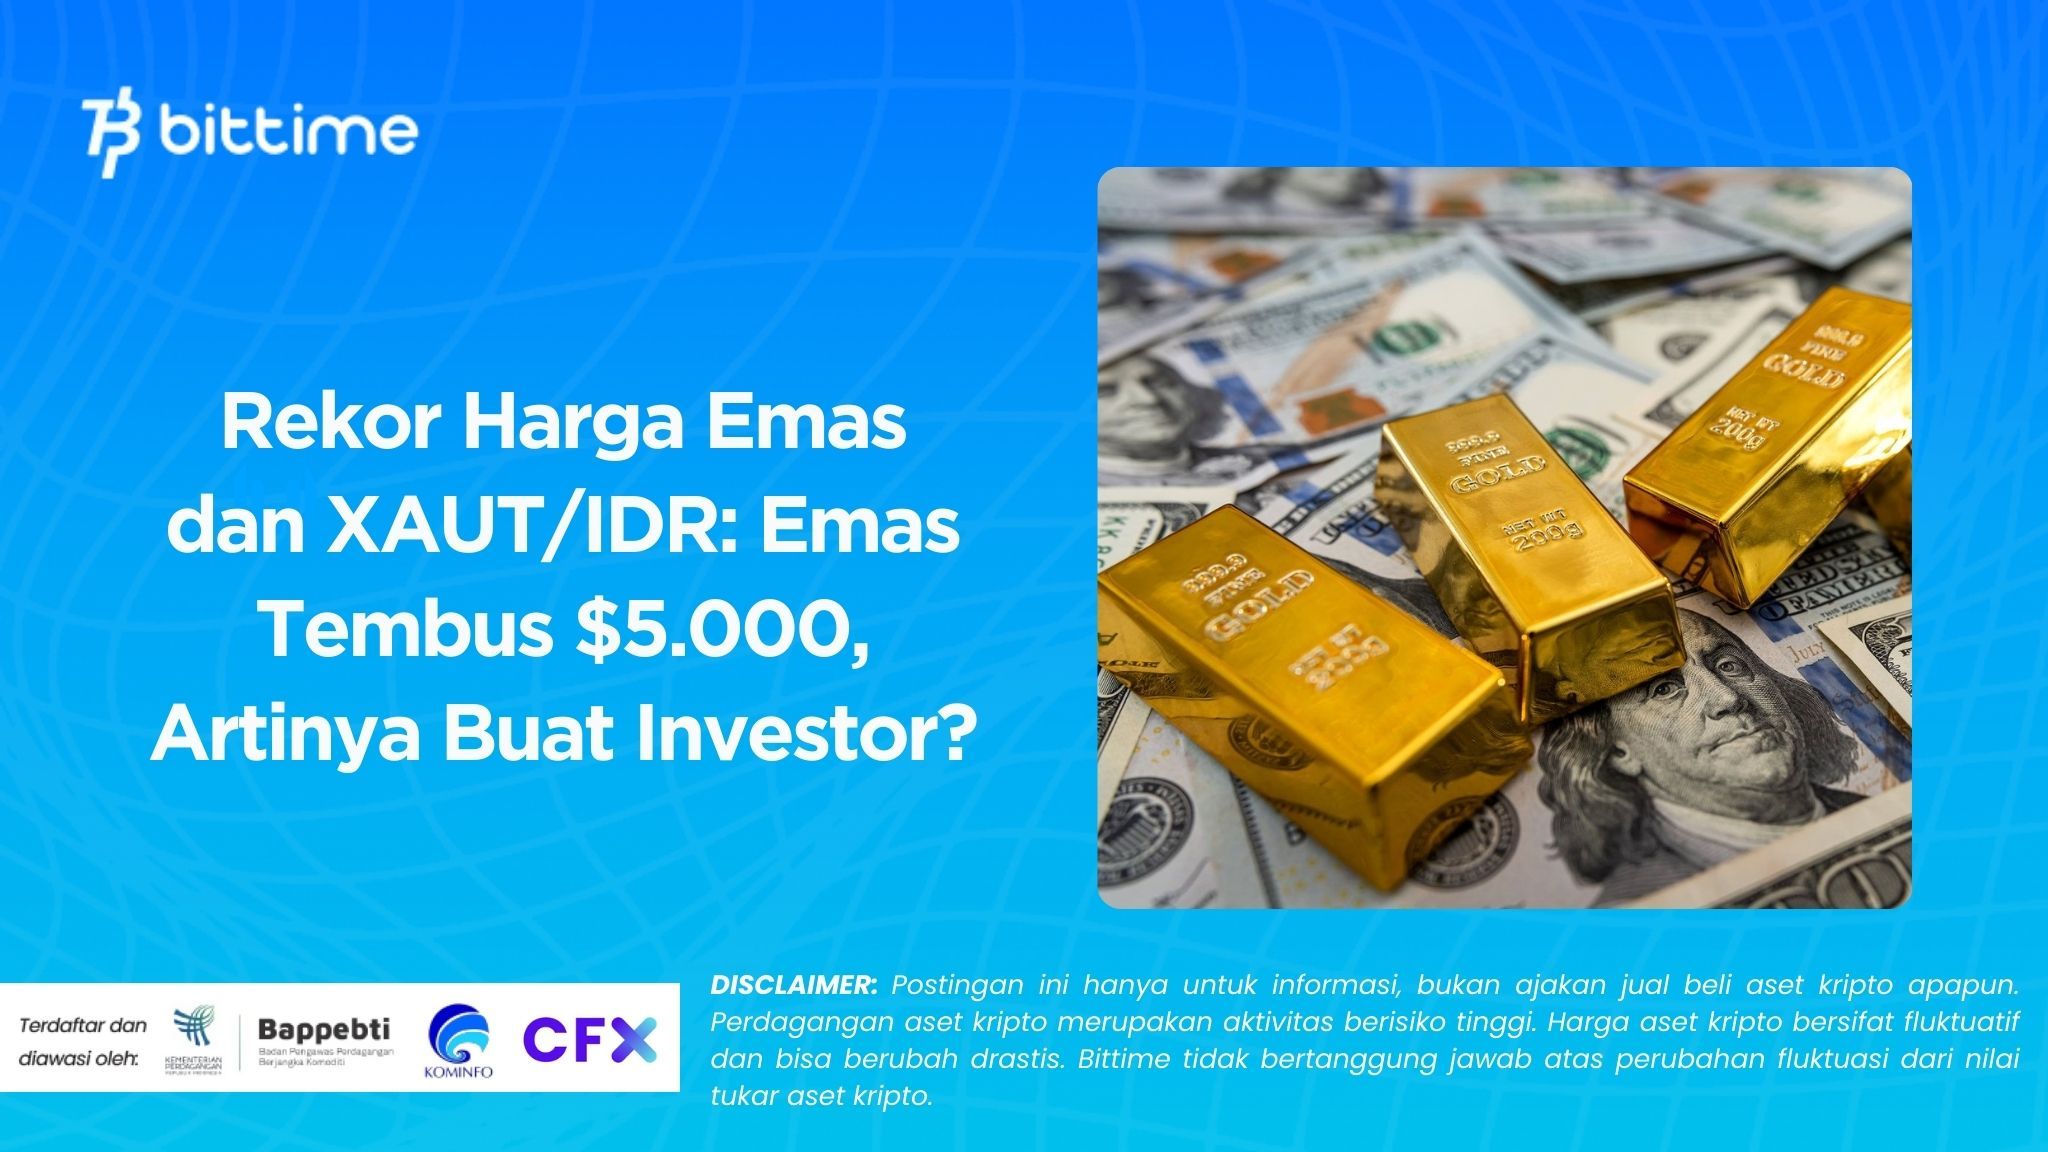
Introduction: January 2026 turned into a “hot” month for precious metals. The gold record (XAU) drew attention as gold broke $5,000 per ounce for the first time in history. Many people are asking: is this the start of a new trend or just short-lived euphoria?
At the same time, digital gold assets like XAUT are also being closely watched because their moves show up faster in the market.
We will summarize the big-picture drivers behind the rally, how it connects to global safe-haven demand, and how to read the XAUT/IDR chart from the graph. The goal is simple: you can make calmer, more measured decisions, not ones driven by FOMO.
Key Takeaways:
- Gold breaking $5,000 per ounce put the spotlight back on global safe-haven assets.
- The “debt and policy uncertainty” narrative pushed hedging demand sharply higher.
- XAUT/IDR tends to track gold, but it still carries the volatility rhythm of the crypto market.
Gold Record (XAU): Why Did Gold Break $5,000 Per Ounce?
This gold rally is often linked to a mix of policy uncertainty, fiscal concerns, and a shift in risk appetite. In market narratives, the escalation of U.S.–Canada–China tariff tensions triggered a flight to safe-haven assets, lifting hedging demand.
There are also reports that gold rose by more than $650 throughout January 2026, making the momentum look “unusually fast” to some investors.
In a phase like this, the safest approach is to separate two things: the big trend (macro) and the short-term pullback risk (technical). Gold can stay strong when uncertainty is high, but it is still normal for the market to take a breather through a temporary correction.
What typically drives a global safe-haven rally?
- Policy and trade uncertainty that increases market volatility.
- Concerns about purchasing power and debt burdens that push investors toward hedging assets.
- Portfolio diversification flows when risk assets feel “expensive” or fragile.
Read Also: Crypto Trading Strategies for Beginners, Do Not Do This!
Gold Price Record and Its Impact on XAUT/IDR?
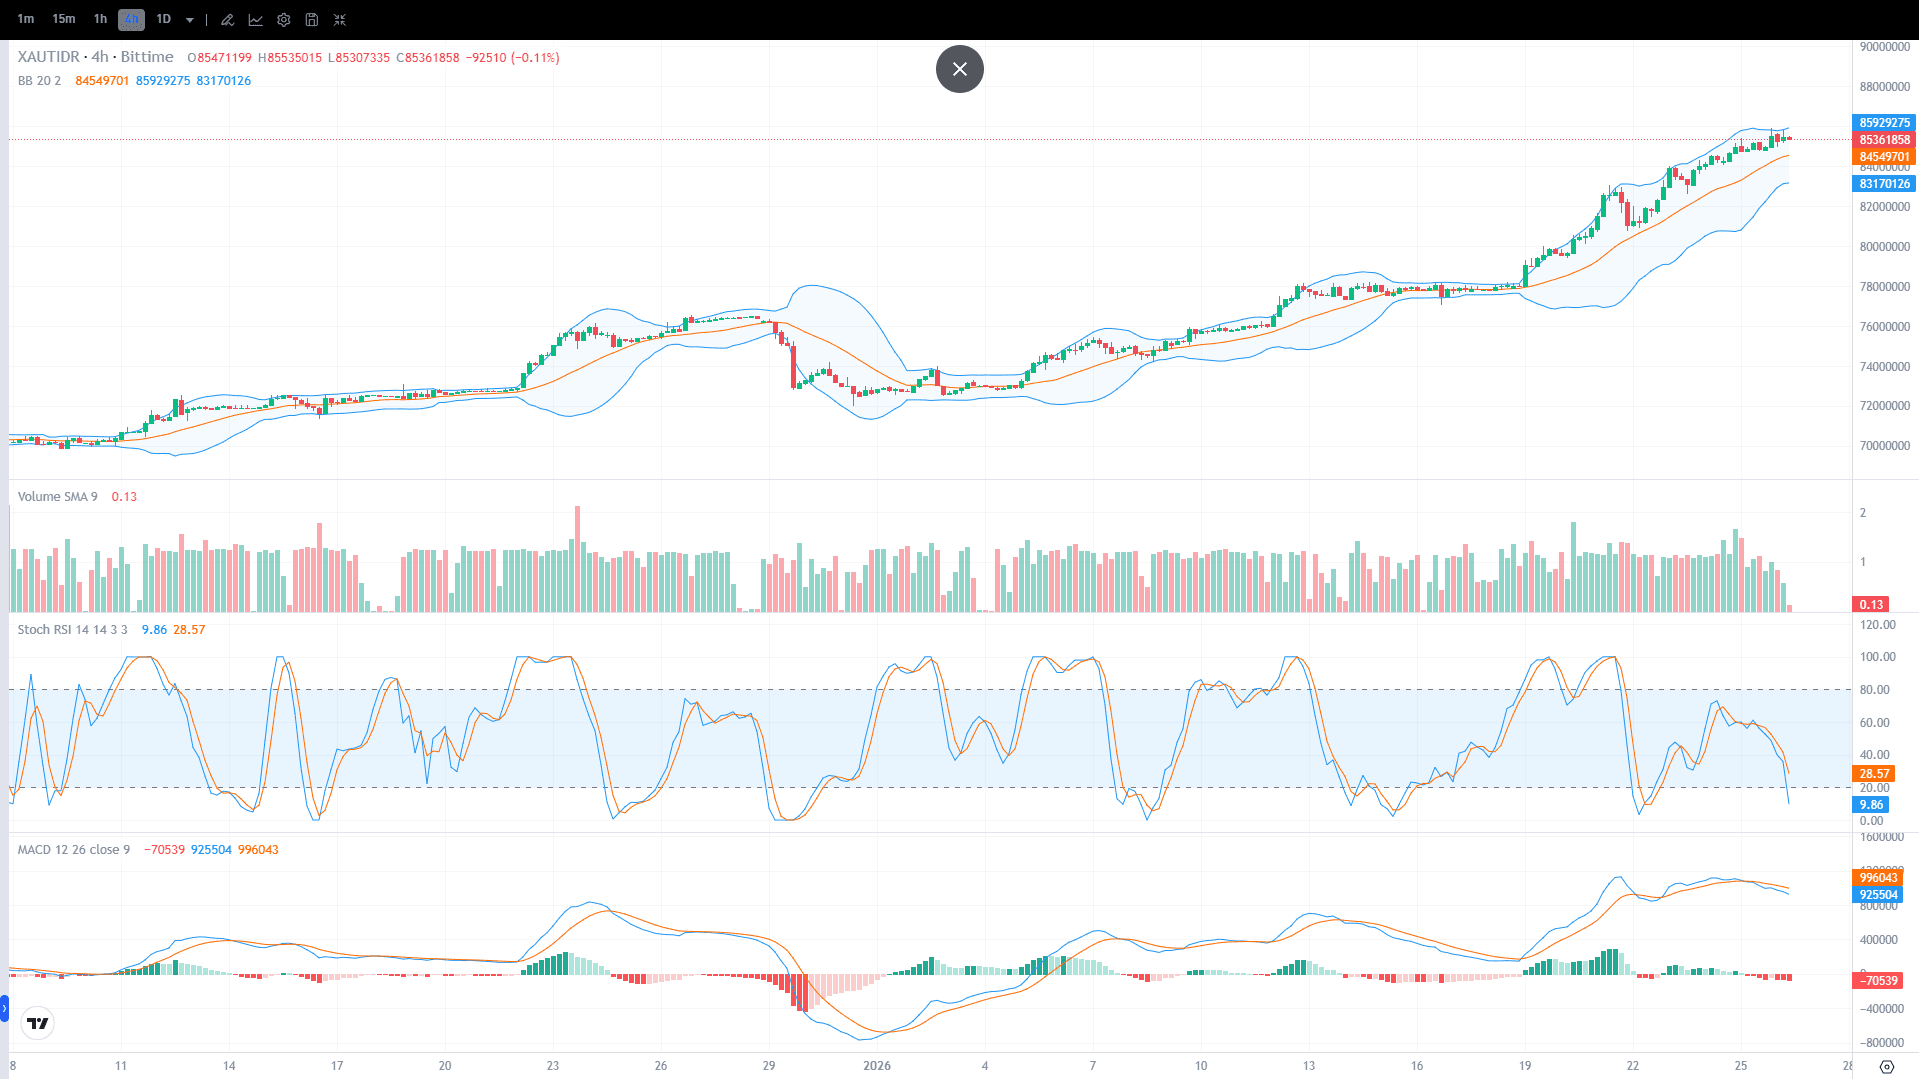
From the XAUT/IDR chart, the main trend still looks bullish, but there are short-term “fatigue” signals. The latest price is around 85.36 million, while the Bollinger Bands highlight key ranges: the upper band around 85.93 million, the mid band around 84.55 million, and the lower band around 83.17 million.
Simply put, when price hugs the upper band during an uptrend, the market can keep pushing higher, or it can pull back briefly for normalization.
On the lower indicator, Stoch RSI appears to be in a low zone, which is often read as a potential bounce signal, but it is not a guarantee without confirmation from the next candles. Because XAUT is a traded digital gold asset, disciplined risk management still matters.
Read Also: 7 Proven Ways to Trade Crypto for Beginners, Complete with Tips and Tricks
Practical XAUT/IDR levels from the chart
- Nearest resistance: 85.93 million to 86.00 million
- Nearest support: 85.30 million
- Next supports: 84.55 million, then 83.17 million
Read Also: Investing in XAUT in 2026: Is Now the Right Time?]

Conclusion
The gold record (XAU) that pushed gold to $5,000 into major headlines reinforces gold’s image as a global safe haven, especially when policy and trade tensions rise. For XAUT/IDR, the chart shows an uptrend that remains dominant, with 85.93 million as a key resistance area and 84.55 million as a critical support.
If you want more flexible access than physical gold, you can monitor and consider investing in digital gold XAUT directly here.
While monitoring the market, you can also explore other opportunities: trade on Bittime Exchange or read the latest crypto news and insights on Bittime Blog.
FAQ
Did gold really break $5,000 per ounce?
Yes. Some market reports state that gold broke $5,000 per ounce for the first time, drawing widespread attention.
What is the main trigger behind the global safe-haven rally?
It is typically a combination of policy uncertainty, geopolitical tension, and economic concerns that pushes investors to seek hedges.
Does XAUT/IDR always match global gold prices?
The broad direction tends to track gold, but daily moves can be influenced by market dynamics and liquidity.
After a record, will the price definitely keep rising?
Not always. After a sharp surge, a short-term pullback is normal. What matters is your risk plan and investment horizon.
What is a simple way to monitor XAUT/IDR?
Watch the support and resistance levels on the chart, see whether price holds above the mid band area, then adjust a step-by-step strategy accordingly.
Disclaimer: The views expressed belong exclusively to the author and do not reflect the views of this platform. This platform and its affiliates disclaim any responsibility for the accuracy or suitability of the information provided. It is for informational purposes only and not intended as financial or investment advice.

.png)