DOGE Price Prediction October 2026: Chances of Returning to 0.10?
2026-10-02
The DOGE price prediction for early October 2026 shows a correction following the previous rise. On the daily chart used, the latest price is 0.09376, still above the middle line of Bollinger Bands at 0.09112. Can this area hold off further weakness and open the possibility of retesting 0.10?
The chart shows the price retreating after briefly moving above 0.10, while the latest candle remains above the 20-period average. The following analysis discusses the areas to monitor, three potential price scenarios, and the conditions that could invalidate the recovery outlook. All figures are chart snapshots, not live prices at the time the article is read.
Key Takeaways
- DOGE is priced at 0.09376, above the Bollinger Bands middle line at 0.09112.
- The 0.10 area and the upper band at 0.1040 are reference points to monitor if the price strengthens again.
- A daily close below the middle line could weaken the recovery scenario, but does not guarantee that the price will reach the lower band.
Latest DOGE Price on the Daily Chart
The latest DOGE price in the screenshot is 0.09376. The latest candle recorded an open of 0.09432, a high of 0.09442, and a low of 0.09324, with a change of approximately −0.60% from its opening price.
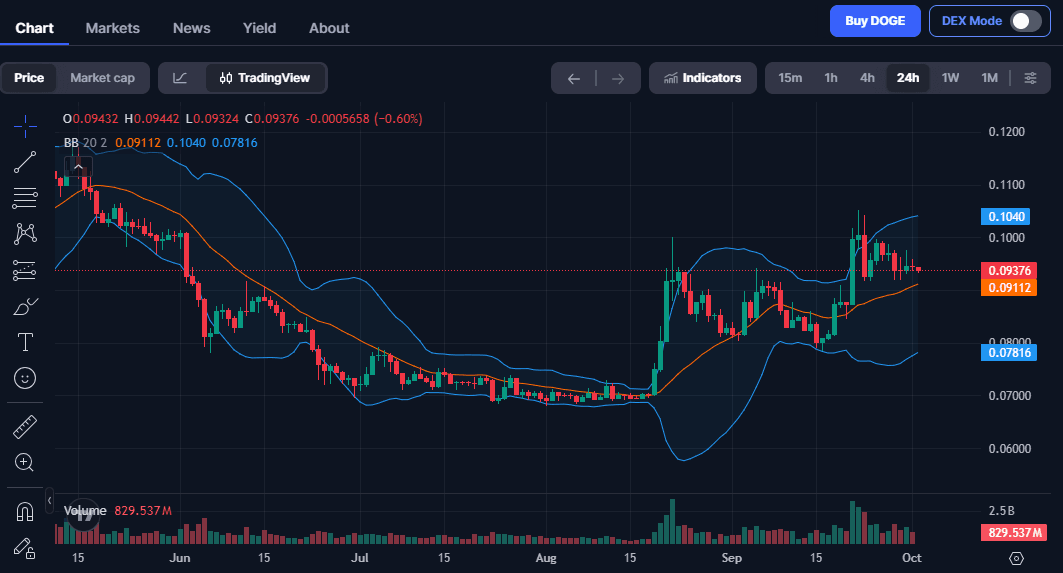
This percentage represents the change in the displayed candle. It is not automatically the same as the rolling 24-hour change usually available on the market information page.
If the candle has not yet closed, its closing price, volume, and formation can still change. Therefore, daily confirmation should use a candle that has already closed.
This chart does not provide seven-day and 30-day changes. These two metrics are not used in the update so that the price discussion continues to use the same snapshot.
Read also: DogeOS Testnet Officially Opens, What Is Its Function for Dogecoin?
DOGE Technical Analysis: Price Above the Middle Line
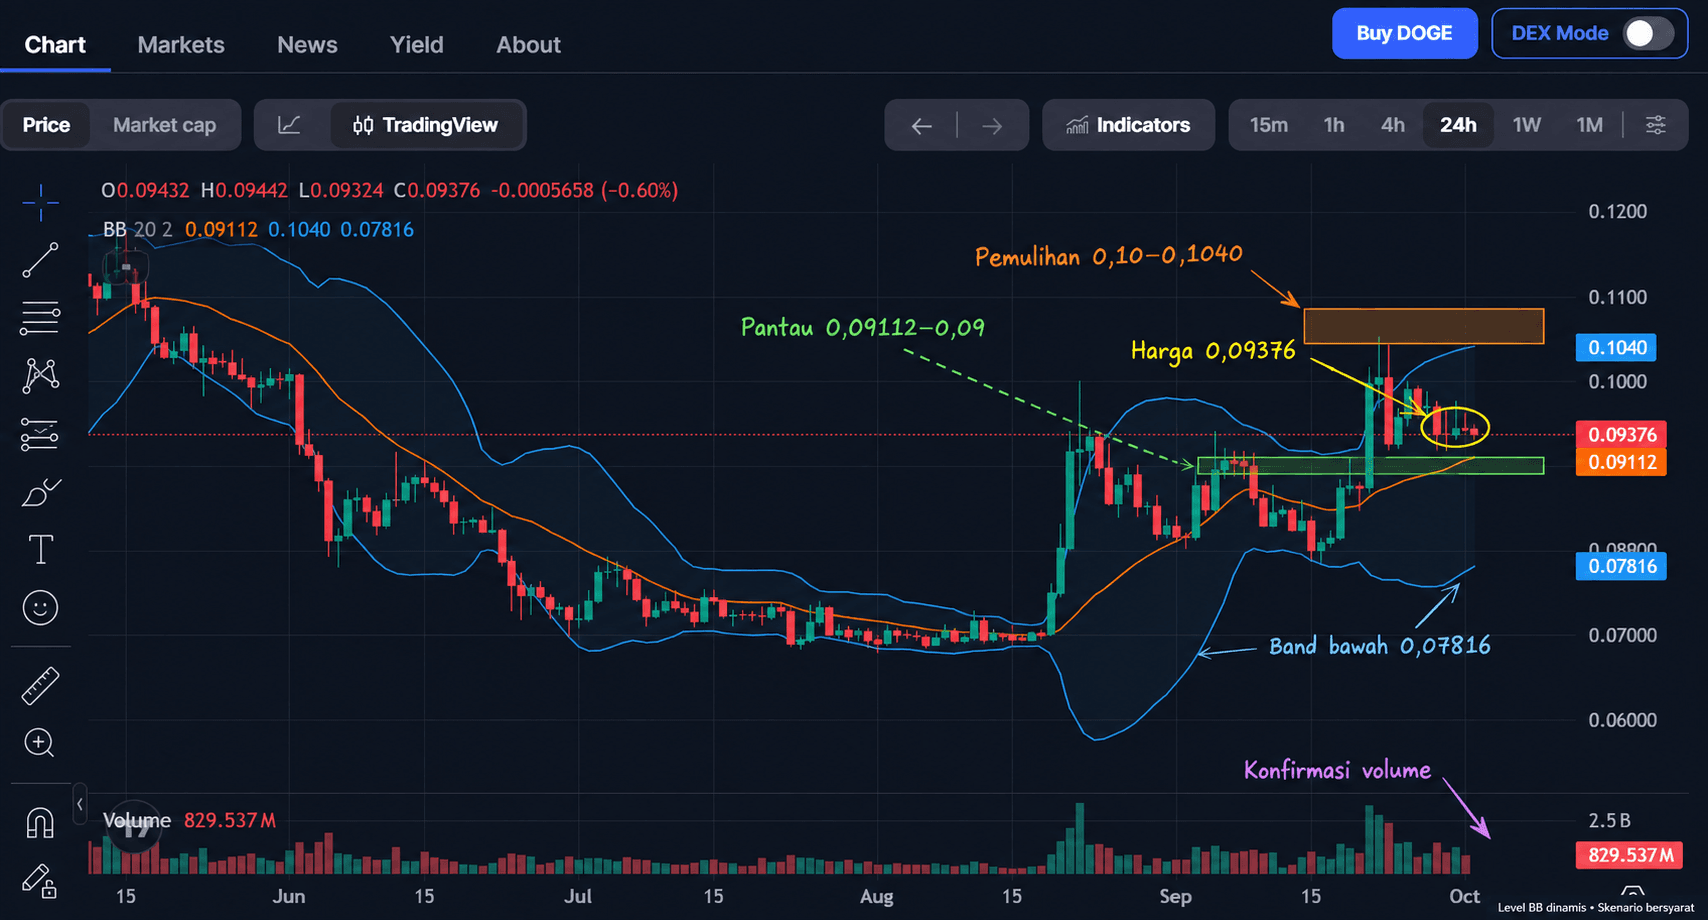
The chart uses a 24h timeframe, or daily candles, with Bollinger Bands set to a period of 20 and a standard deviation of 2. At the time the snapshot was taken, the middle line was at 0.09112, the upper band at 0.1040, and the lower band at 0.07816.
The latest price is between the middle line and the upper band. This position indicates that the price remains above the 20-period average, but does not yet confirm that the correction is over.
0.09112–0.09000 Area: Monitoring Weakness
The Bollinger Bands middle line is the first reference point for observing the price response if the decline continues. The psychological 0.09 level is slightly below it.
Watch whether buyers are able to drive a recovery when this area is tested. Candle closes and the response on subsequent tests can help assess whether this area is actually receiving support.
The middle line is a moving average, so its value will change as new data comes in. This area should not be considered a fixed support level based on a single snapshot.
0.10000–0.10400 Area: Monitoring Recovery
The chart shows that the price briefly moved above 0.10 before falling again. This level serves as a threshold for evaluating whether buyers can restore momentum.
If the price strengthens again, the upper band at 0.1040 becomes the next reference point. However, the upper band also changes and is not a fixed boundary that will necessarily stop further gains.
A breakout should be assessed through the candle close and the ability to hold the area after a retest. A brief touch is not enough to declare a successful breakout.
Lower Band at 0.07816: Reference for Further Risk
The lower band is at 0.07816 on the chart used. This value is a dynamic indicator boundary, not a guaranteed downside target.
If the price loses the middle line, first examine the nearest lows and reaction areas. Do not immediately conclude that DOGE will reach the lower band.
Using the lower band is more appropriate as part of volatility monitoring. A price target still requires a basis in the chart structure explained separately.
Volume Has Not Provided Strong Confirmation
Visually, several of the latest volume bars are smaller than the spike recorded during the previous rise. This condition means that a recovery toward the upper area should be accompanied by an examination of trading activity.
However, the volume of the current candle is not yet complete. Compare completed candles before concluding that momentum is weakening or that a breakout has sufficient support.
High volume also does not automatically indicate net buying. Readers need to examine price direction, candle closes, and the sustainability of the movement together.
DOGE Price Prediction: Three Scenarios After the Correction
The following scenarios focus on the first few days of October. This discussion does not establish a month-end closing price or guarantee that any particular level will be reached.
1. Bullish Scenario: The Middle Line Holds and Price Reclaims 0.10
The recovery outlook receives support if the price holds the middle-line area and then moves back above 0.10. The upper band around 0.1040 becomes the next reference point as long as its value has not changed materially.
Stronger confirmation requires a daily close and the ability to hold the breached area. Volume should be compared with previous candles to evaluate the quality of the movement.
This scenario weakens if the price loses the middle line again. If the breakout only lasts briefly, readers should wait for additional evidence before concluding that the uptrend is continuing.
2. Neutral Scenario: Price Holds Without a Convincing Recovery
The neutral framework applies if the price remains above the middle-line area but is unable to reclaim 0.10. This area is a monitoring range, not a confirmed consolidation.
In this condition, the price response on both sides is more useful than guessing the direction in the middle of the range. Small candles or brief movements are not enough to determine the next move.
Watch whether a test of the lower area produces a recovery and whether approaches toward the upper area are rejected again. Repeated response patterns can help clarify the price structure.
3. Bearish Scenario: The Middle Line Is Lost and the Retest Fails
The risk of further weakness increases if the daily candle closes below the middle line and the price fails to recover during a retest. Movement below 0.09 provides additional reason to examine the downward structure.
The lower band remains a reference for further risk, not an automatic target. Reaction areas before reaching that band should be examined on the chart.
The bearish scenario should be reassessed if the price holds above the middle line again. The analysis should change when the price evidence no longer supports the initial conclusion.
Read also: Dogecoin Rises Again, Is US$1.66B Open Interest a Bullish Signal?
How to Read Bollinger Bands on DOGE?
Bollinger Bands help evaluate the price position relative to the average and changes in volatility. In this chart setup, the middle line uses a 20-period average, while the bands are formed using a standard deviation of 2.
A price above the middle line means the price is above that average. This condition alone is not enough to state that the entire trend is bullish.
A price approaching the upper band also does not automatically provide a sell signal. In a strong trend, the price can continue moving near the upper band for several candles.
Conversely, an approach toward the lower band does not necessarily represent a buying opportunity. The price can still decline if selling pressure continues.
Use this indicator together with the structure of highs and lows. Avoid adding other indicators without explaining the additional evidence you are trying to obtain.
Read also: Dogecoin and X Money: Is This the Beginning of a New Bull Run for DOGE?
5 Factors to Consider in Dogecoin Analysis
1. Crypto Market Conditions
Compare DOGE's movement with Bitcoin and the broader market. This comparison helps assess whether a price change is occurring across the market or is more specific to DOGE.
Relationships between assets can change. Do not assume that a rise in Bitcoin will always produce a DOGE response in the same direction or magnitude.
2. Trading Pair Liquidity
Liquidity affects the market's ability to absorb orders. A thin order book can cause the execution price to differ from the displayed price.
Check the spread and market depth of the pair being used. Volume data from multiple exchanges does not automatically describe trading conditions on a single platform.
3. Usage and Technology Development
Development information should be distinguished between plans, testing, and implementation. An announcement alone does not prove sustained usage.
Evaluate whether the development requires DOGE and how its use can be verified. Avoid concluding that there will be a price impact based solely on a news headline.
4. Changes in Supply and Demand
Fundamental analysis needs to consider the amount of coins available as well as market demand. Additional supply does not automatically lower the price, but it remains part of the evaluation.
Demand also needs to be distinguished between actual usage and speculative activity. A temporary increase in interest does not prove sustained growth.
5. Large Transactions and Derivatives Positions
Large wallet transactions do not directly prove investor accumulation or selling. Fund transfers may involve exchange wallets or internal transfers.
When discussing open interest, funding rates, or liquidations, use dated data. The chart used in this article does not provide these metrics.
Read also: What Is DRC-20 and How Are DRC-20 Coins Changing the Dogecoin Ecosystem?
What Is Dogecoin and Why Is Price Analysis Important?
Dogecoin is a peer-to-peer digital currency with an open blockchain network. DOGE can be used to transfer value between users through transactions on the network.
However, network functionality and market price are two things that need to be evaluated separately. The ability to transfer an asset does not determine the price buyers are willing to pay.
Price analysis helps establish observable conditions. Its purpose is to clarify the basis for decisions and risk limits, not to guarantee transaction outcomes.
Advantages and Risks of DOGE
An open network allows users to inspect transaction information and publicly available activity. Market charts also provide material for evaluating price changes.
On the other hand, the quality of a decision still depends on the accuracy of the interpretation. Popularity and community activity do not guarantee profits.
Risks to consider include:
- Price changes before the transaction is completed.
- Spread and slippage on certain trading pairs.
- A breakout that quickly reverses.
- Mistaking indicator bands for guaranteed targets.
- The use of leverage, which can magnify losses.
- Account security and asset storage.
Read also: How to Get Free Dogecoin? Which Method Would You Like to Try!
Is DOGE Still Worth Buying?
Whether DOGE is suitable depends on your objectives, holding period, and ability to tolerate losses. The price being above the middle line is not sufficient to answer that question for every reader.
Before considering a transaction, take the following five steps:
- Check the live price and trading pair.
- Determine the decision horizon.
- Write down the scenario triggers and invalidation conditions.
- Calculate risk limits, costs, and potential slippage.
- Evaluate whether subsequent data changes the plan.
If you want to continue monitoring, you can sign up for Bittime and open the DOGE price page. Use the price available at that time before making a decision.
What Should Be Monitored Next?
The next monitoring focus is the price response to the middle line and its ability to move back above 0.10. Also check whether volume supports the movement after the candle closes.
Bollinger Bands values need to be updated along with new data. Do not treat snapshot figures as if they were permanent levels.
If the price invalidates the initial scenario, revise the analysis and explain what has changed. The update date should reflect changes to the content.
Conclusion
The DOGE price prediction based on the latest chart shows a correction following the rise, with the price still above the Bollinger Bands middle line. The 0.09112–0.09 area serves as a reference for weakness, while 0.10–0.1040 is used to monitor a recovery.
Indicator levels are dynamic and do not guarantee price direction. Monitor updates through Bittime, wait for confirmation, and reassess the scenario when conditions change.

Bittime is a licensed Digital Financial Asset Trader (PAKD) platform supervised by the Financial Services Authority — where you can buy Bitcoin in Indonesia and hundreds of other crypto assets starting from Rp10,000. Registration is fast and secure, and you can get started today.
Monitor USDT to IDR conversion rates and the price movements of your favorite crypto assets in real time. Everything is available in a single crypto investment app that can be downloaded for free from the Play Store.
Ready to get started? Sign up now on Bittime and execute your investment strategy with a platform trusted by millions of users in Indonesia.
FAQ
What is the latest DOGE price on the chart?
The latest price in the screenshot is 0.09376. This is a snapshot and should be checked again before making a transaction.
Is DOGE likely to return to 0.10?
That possibility can be evaluated if the price holds the middle-line area and strengthens again. The candle close and the ability to hold after the breakout can help confirm the recovery.
Is 0.09112 DOGE support?
This figure is the Bollinger Bands middle line in the snapshot. This level can serve as a monitoring reference, but its strength as support requires evidence from the price response.
Will DOGE fall to 0.07816?
There is no certainty that the price will reach that figure. It is a dynamic lower-band value, so the price structure and previous reaction areas still need to be examined.
Does the −0.60% change mean DOGE fell over 24 hours?
This figure represents the change in the displayed candle from its opening price. It is not automatically the same as the rolling 24-hour change on the market page.
Disclaimer: The views expressed belong exclusively to the author and do not reflect the views of this platform. This platform and its affiliates disclaim any responsibility for the accuracy or suitability of the information provided. It is for informational purposes only and not intended as financial or investment advice.

.png)