Bitcoin Price Prediction Today: 4H Chart Signals Potential Break Above $70,000
2026-02-15
Bitcoin price prediction today is leaning cautiously bullish as BTC trades near $69,880 on the 4 hour chart. After a sharp correction from the $80,000 region toward the mid $60,000 zone, price action is showing signs of stabilization and gradual recovery.
The latest BTCUSDT 4H chart reveals improving momentum, tightening structure, and a potential breakout setup forming near the $70,000 resistance area. Traders are now watching whether Bitcoin can reclaim the psychological $70K level or face another short term pullback.
This analysis breaks down the current structure, key technical indicators, major support and resistance zones, and possible 24 to 72 hour scenarios.
Key Takeaways
- Bitcoin is consolidating above $68,000 after rebounding from the $65,000 support zone.
- Momentum indicators show early bullish strength but no confirmed major trend reversal yet.
- A breakout above $70,000 could open upside toward $72,000 to $74,000.
Current Market Structure on the 4H Chart
On the 4 hour timeframe, Bitcoin remains in a broader corrective structure following its previous decline. The chart shows a sequence of lower highs earlier, but recent candles are forming higher lows, suggesting that sellers are losing control.
BTC/IDR Price on Bittime
A strong rebound occurred near the $65,000 to $66,000 demand zone, accompanied by increased volume. Since that bounce, BTC has been moving sideways to slightly upward, building a base above $68,000.
This consolidation phase is critical. If buyers maintain pressure, the structure may shift from corrective to short term bullish continuation.
However, confirmation requires a clean breakout above nearby resistance.
Bollinger Bands Analysis
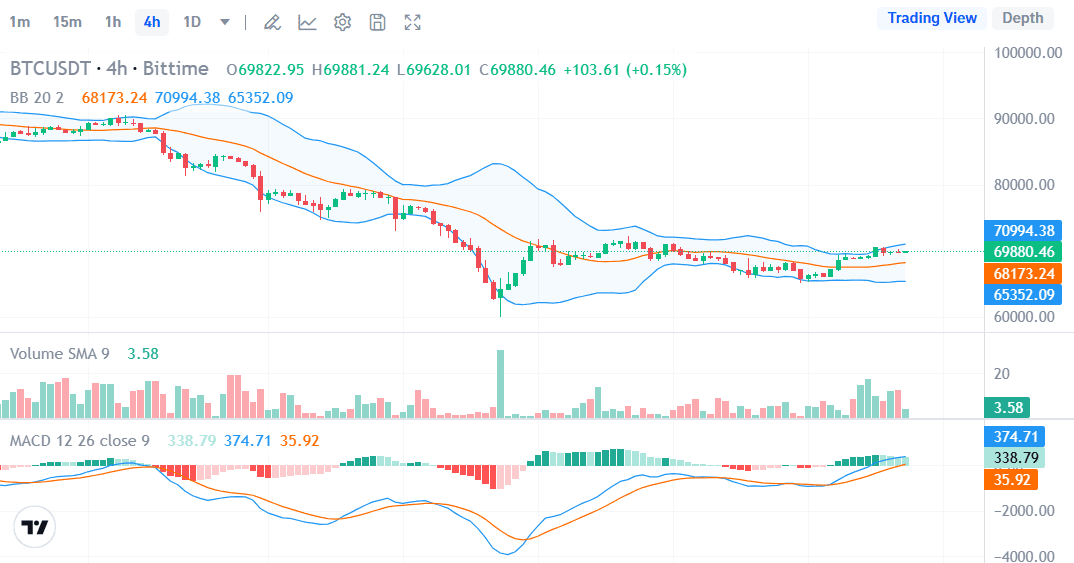
The Bollinger Bands on the 4H chart provide valuable insight:
- Middle Band (20 MA): approximately $68,173
- Upper Band: approximately $70,994
- Lower Band: approximately $65,352
Price is currently trading slightly above the middle band and approaching the upper band. The bands are beginning to widen after a contraction phase, signaling a potential volatility expansion.
If Bitcoin closes strongly above the upper band near $71,000 with rising volume, it could trigger momentum buying.
Failure at this level may result in a retest of the middle band around $68,000.
MACD Momentum Signals
The MACD indicator is showing encouraging signs:
- Bullish crossover has already occurred
- Histogram bars are turning positive
- Momentum slope is gradually increasing
This suggests bearish pressure has weakened and buyers are slowly regaining control.
While the momentum is not explosive, it supports the case for controlled upward continuation rather than an immediate sharp breakout.
Key Support Levels
The following levels are critical for maintaining short term bullish structure:
Immediate Support:
$68,000 to $68,200
This area acts as the current pivot zone. Holding above it strengthens bullish momentum.
Strong Support Zone:
$65,000 to $66,000
This is where strong buying previously emerged. A return to this area could attract renewed demand.
Major Structural Support:
$60,000 to $62,000
A breakdown below $65,000 would shift market sentiment significantly bearish.
Key Resistance Levels
Bitcoin faces several resistance barriers ahead:
First Resistance:
$70,000 to $71,000
This is the immediate breakout level and psychological barrier.
Major Resistance:
$74,000 to $76,000
If $71,000 breaks, this becomes the next upside target.
Trend Reversal Confirmation:
Above $80,000
A sustained move above $80K would confirm a broader bullish continuation.
Bitcoin Price Prediction: 24 to 72 Hour Outlook
Bullish Scenario
If BTC holds above $68,000 and volume increases:
- Target 1: $70,000
- Target 2: $72,000
- Extended target: $74,000
A decisive breakout above $71,000 could accelerate buying pressure.
Estimated probability: 55 percent.
Bearish Scenario
If Bitcoin fails to hold $68,000:
- Retest $66,000 likely
- Breakdown below $65,000 could open downside toward $62,000
Estimated probability: 45 percent.
Market Sentiment Considerations
Beyond technical indicators, Bitcoin’s short term movement can also be influenced by:
- US Dollar strength
- ETF inflows and outflows
- Broader crypto market sentiment
- Macro economic developments
A risk on environment could support further upside, while sudden macro uncertainty may trigger volatility.
Conclusion
This Bitcoin price prediction today based on the 4H BTCUSDT chart suggests a cautious bullish bias. Momentum indicators are improving, and price structure shows stabilization above key support.
However, confirmation depends on a clean break above $70,000 to $71,000. Until then, Bitcoin remains in a recovery phase within a broader corrective pattern.
Traders should closely monitor the $68,000 pivot zone, as it will likely determine the next short term direction.
FAQ
Is Bitcoin currently bullish?
On the 4H timeframe, Bitcoin shows short term bullish momentum but has not confirmed a full trend reversal.
What is the most important support level right now?
The $68,000 level is the key short term support.
What happens if Bitcoin breaks above $71,000?
A breakout above $71,000 could push price toward $72,000 to $74,000.
What is the downside risk?
Losing $68,000 may trigger a retest of $66,000, with deeper risk toward $62,000.
Is this analysis for long term investing?
No. This analysis focuses on short term movement using the 4H chart.
How to Buy Crypto on Bittime

Want to trade sell buy Bitcoins and crypto investment easily? Bittime is here to help! As an Indonesian crypto exchange officially registered with Bappebti, Bittime ensures every transaction is safe and fast.
Start with registration and identity verification, then make a minimum deposit of IDR 10,000. After that, you can immediately buy your favorite digital assets!
Check the exchange rate BTC to IDR, ETH to IDR, SOL to IDR and other crypto assets to find out today's crypto market trends in real-time on Bittime.
Also, visit the Bittime Blog for interesting updates and educational information about the crypto world. Find reliable articles about Web3, blockchain technology, and digital asset investment tips designed to enrich your crypto knowledge.
Disclaimer: The views expressed belong exclusively to the author and do not reflect the views of this platform. This platform and its affiliates disclaim any responsibility for the accuracy or suitability of the information provided. It is for informational purposes only and not intended as financial or investment advice.

.png)